
FIG 10.
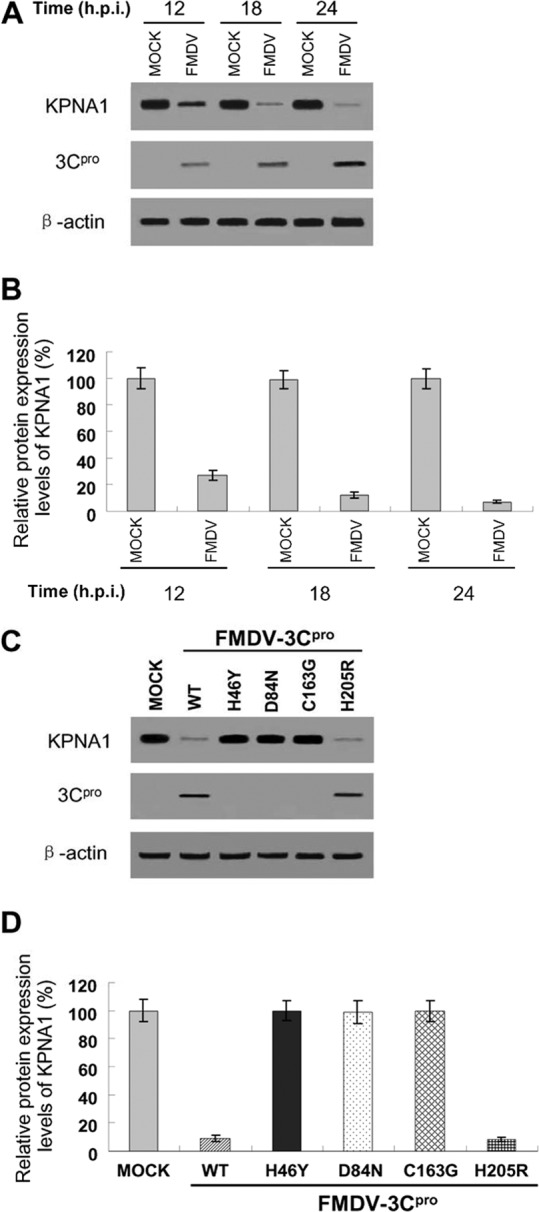
Reduction of endogenous KPNA1 levels by infection with FMDV or rescued FMDV using an infectious cDNA clone. (A) PK-15 cells were infected at an MOI of 1.0 with FMDV type O, strain Tibet/CHA/99, and harvested at the indicated times for Western blotting using antibody against KPNA1, mouse anti-3C serum, or β-actin. The data presented here are results from one experiment of three Western blotting experiments. (B) Densitometry analysis of the digital image of KPNA1 in PK-15 cells infected with FMDV from three independent experiments. The band intensities of blotting with KPNA1 antibody are shown as the relative protein expression levels, normalized with β-actin. Data are the means ± the standard deviations (error bars) of three experiments. (C) Supernatants from BHK-21 cells transfected with RNA of individual FMDV infectious cDNA clones were used to infect PK-15 cells at an MOI of 1.0. An equal volume was used to infect PK-15 cells for infectious cDNA clones harboring the 3C mutation H46Y, D84N, or C163G, which were completely unable to produce virus. PK-15 cells were harvested at 24 hpi for Western blotting using antibody against KPNA1, mouse anti-3C serum, or β-actin. The data presented here are results from one experiment of three Western blotting experiments. (D) Densitometry analysis of the digital image of KPNA1 in PK-15 cells infected with rescued FMDV using an infectious cDNA clone from three independent experiments. The band intensities of blotting with KPNA1 antibody are shown as the relative protein expression levels, normalized with β-actin. Data are the means ± the standard deviations (error bars) of three experiments.