Figure 4.
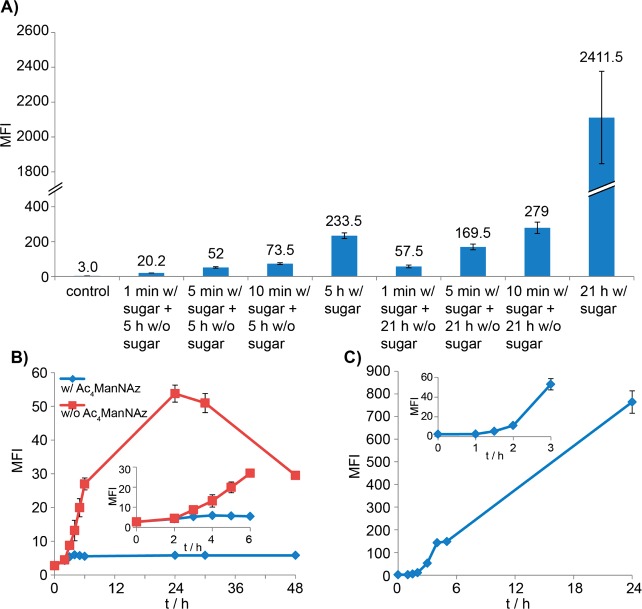
Monitoring the cellular uptake and metabolism of peracetylated ManNAc derivatives in Jurkat cells. (A) Monitoring the cellular uptake and metabolism of Ac4ManNAl in Jurkat cells by treating cells with 50 μM Ac4ManNAl for 1, 5, or 10 min, followed by growing the cells in Ac4ManNAl-free medium for 5 or 21 h. (B) Monitoring the cellular uptake and metabolism of peracetylated ManNAc derivatives in Jurkat cells by a pulse-chase labeling. Pulse, Ac4ManNAl (50 μM, 1 min); Chase, Ac4ManNAl-free medium with or without the addition of Ac4ManNAz. The red curve represents the alkyne-dependent MFI at various time intervals when chasing with an unnatural sugar-free medium. The blue curve represents the alkyne-dependent MFI at various time intervals when chasing with 50 μM Ac4ManNAz. (C) Monitoring the cellular uptake and metabolism of Ac4ManNAz in Jurkat cells that are treated with Ac4ManNAl (50 μM, 1 min) followed by Ac4ManNAz (50 μM) treatment. The curve shows azide-dependent fluorescence at various time intervals. Data shown in (A) and (B) were obtained using biotin azide 7.

