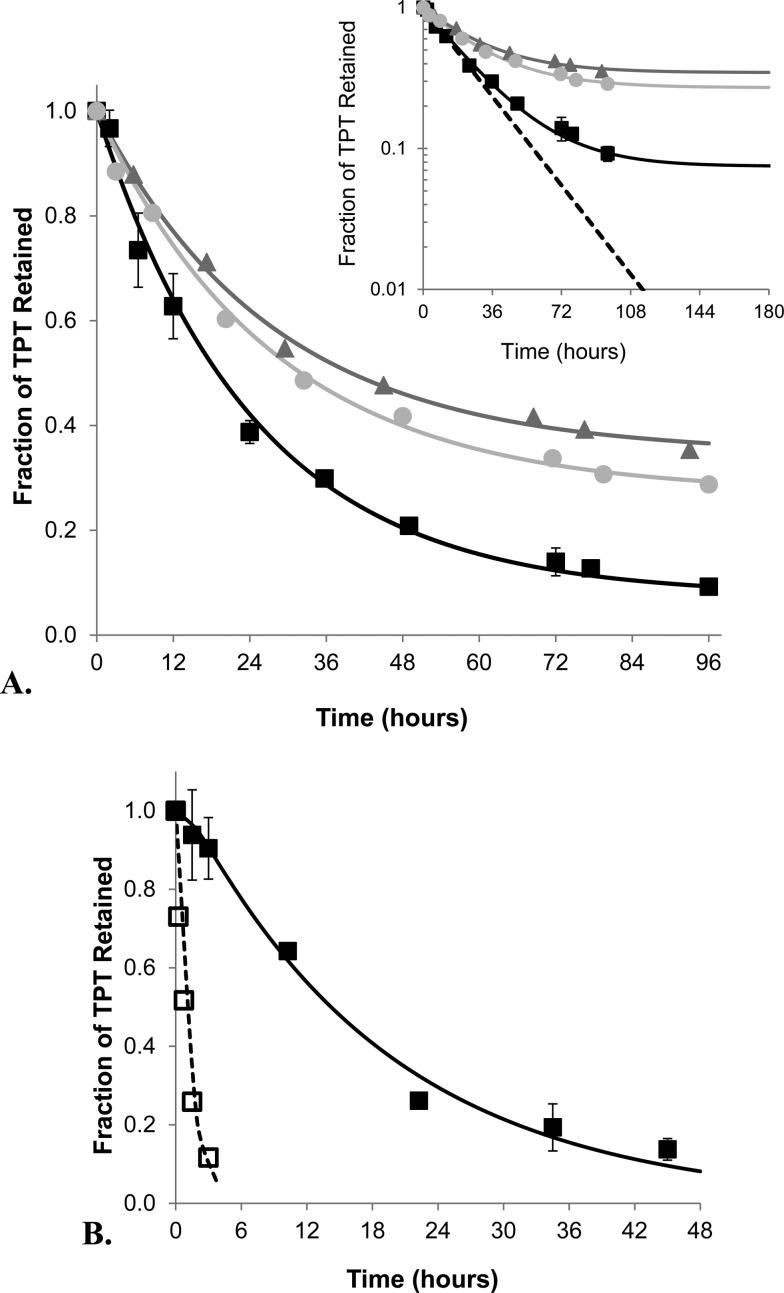
Figure 3.
Comparison of the release profiles of TPT from DSPC/mPEG-DSPE liposomes obtained from ultrafiltration (A) and dynamic dialysis (B) methods at pH 4.0, 37 °C. (A) The release profiles of TPT under nonsink conditions are shown for suspensions of 0.48 (■), 5.44 (gray circle), and 15.3 (gray triangle) mg lipid/mL along with the fits of these data to the mathematical model describing release under nonsink conditions (represented by the lines of corresponding color). The inset at the top right compares the approach to equilibrium occurring under nonsink conditions to a simulated profile of release under sink conditions (--). (B) The release profiles of TPT using dynamic dialysis. After correcting for volume swelling and sampling of the dialysis tube, TPT release from passively loaded liposomes (■) and blank liposome suspensions spiked with free drug (□) were fit simultaneously, producing their respective release profiles (— and --). Error bars indicate the standard deviation at each time point of triplicate release experiments.

