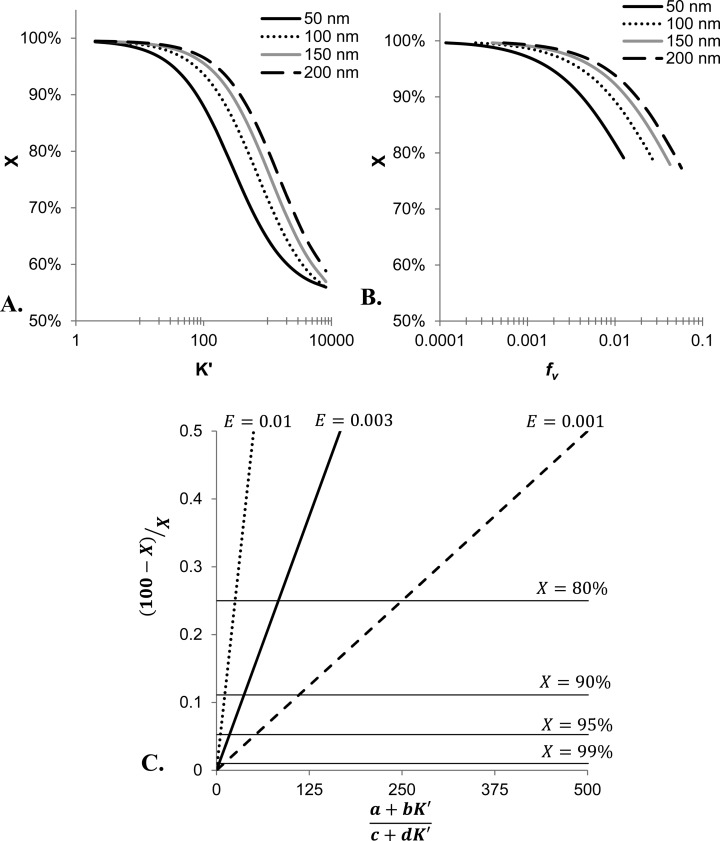
Figure 5.
Effect of experimental parameters on total drug release at equilibrium. (A) Keeping the suspension concentration constant at 0.5 mg/mL, simulations using the equations describing the nonsink model were used to determine the % of released drug, X, as a function of varying values of drug binding coefficients, K′. These simulations are plotted for several common diameters of liposomes. (B) To illustrate the effect entrapped volume, fv, has on the amount of drug released under nonsink conditions, simulations were conducted in which K′ was held constant at 90. The plot shows that increasing fv (i.e., increasing amount of liposomes) reduces the amount of drug released as the volume fraction entrapped increases (i.e., the number of liposomes in the suspension increases). The lines illustrate this trend for liposomes of different diameters indicated by the legend in the upper right corner of the plot. (C) This nomograph provides a general method for estimating the amount of released drug. The plot relates all experimental conditions affecting the amount of drug released during a nonsink release study including the drug binding coefficient, K′, and the volume compartments present in the suspension (a and b for intravesicular aqueous and membrane compartments, and c and d for extravesicular aqueous and membrane compartments) to X (as indicated by the labeled, horizontal lines). This relationship is highly dependent upon the fraction of entrapped volume, E, as the slope steepens dramatically with increasing E (and subsequently higher lipid concentration).

