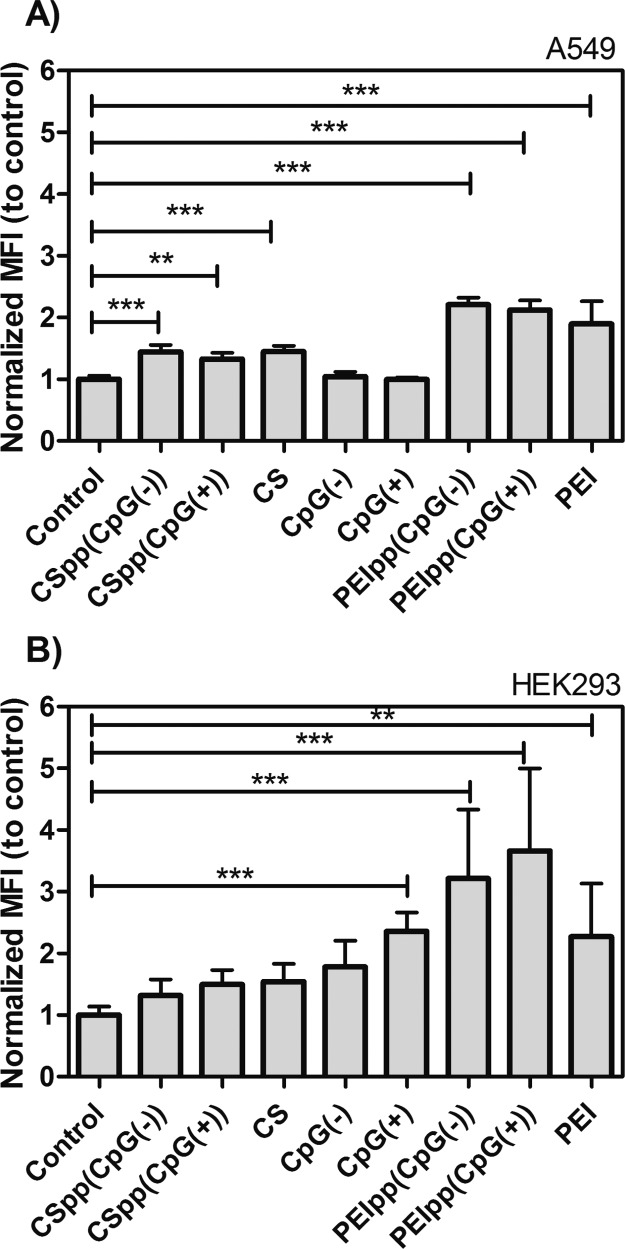
Figure 4.
DHE oxidation levels indicated as normalized mean fluorescence intensity (Normalized MFI) showing estimates of relative intracellular superoxide levels in A549 cells (A) and HEK293 cells (B) treated with indicated polyplexes. Cells were treated with CSpp(CpG(−)) or CSpp(CpG(+)) containing N/P 10. CS is chitosan solution without pDNA. PEIss(CpG(−)) or PEIpp(CpG(+)) are PEI complexes with pDNA at N/P 10. PEI is PEI solution without pDNA. Control = cells treated with PBS. Data are expressed as mean ± SD (n = 6–9). *** p < 0.001, ** p < 0.01.

