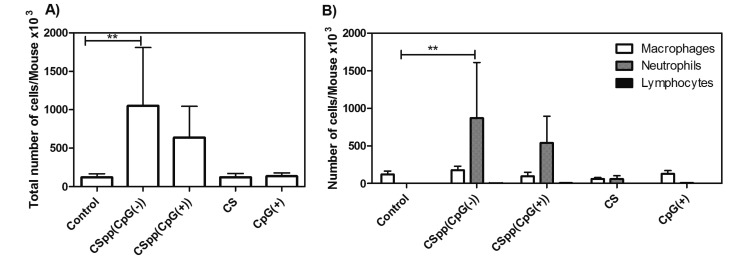
Figure 7.
BAL cell counts: total number of cells (A) and the number of macrophages, neutrophils, and lymphocytes (B) in the BAL fluid/mouse after nasal instillation of indicated CSpp formulations. CS = chitosan solution, CpG(+) = naked CpG(+) pDNA solution. Control = no treatment. Each treatment (aside from control and CS) contained 25 μg of pDNA (12.5 μg of pDNA/50 μg, 2× nasal instillations). Data are expressed as mean ± SD (n = 6). ** p < 0.01.

