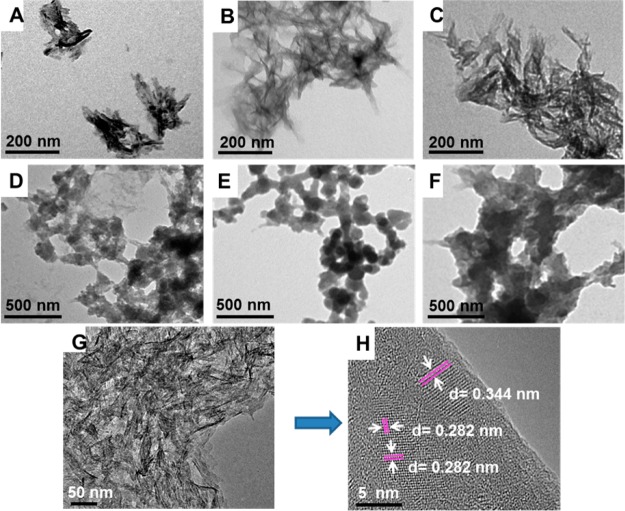
Figure 2.
TEM images showing the nucleation of HAps mediated by AS with different concentrations and mineralization times. (A–C) The mineralization time was 24 h, but the concentration of AS was set at (A) 0.5, (B) 2, and (C) 8 mg/mL; (D–F) The concentration of AS was fixed at 2 mg/mL, but the mineralization time was chosen at (D) 2, (E) 6, and (F) 12 h; (G) HRTEM image showing the nanoneedles of HAps mediated by AS with the concentration of 2 mg/mL after mineralization for 24 h; and (H) is a high magnification image of (G). White arrows show the lattice spacings of 0.344 and 0.282 nm, which are corresponding to the d-spacings of (002) and (211) lattice planes, respectively.

