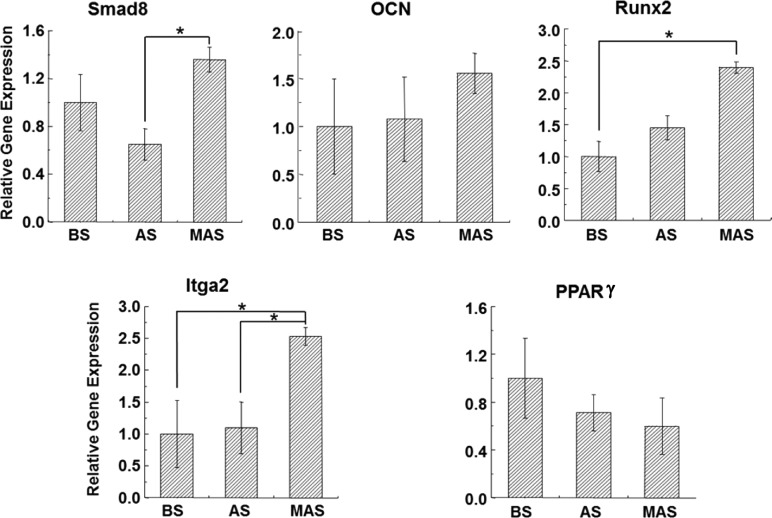
Figure 6.
Levels of mRNA for osteogenic specific genes (Smad8, OCN, and Rux2), integrin (Itga2), and adipose marker PPARγ of h-BMSCs cultured on BS, AS, and MAS in osteogenic medium for 2 weeks. The mRNA levels were quantified using real-time RT-PCR and are normalized to that of the reference gene GAPDH and compared to that of BS groups. *P < 0.05, data are presented as mean ± SD, n = 4. BS, AS and MAS mean B. mori sericin, A. pernyi sericin, and mineralized A. pernyi sericin, respectively.

