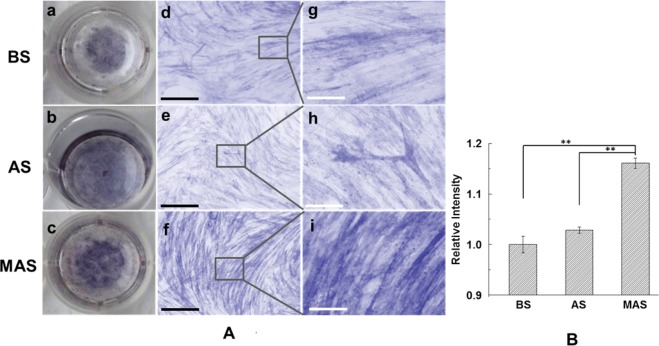
Figure 7.
ALP staining and alizarin red staining of BMSCs cultured on BS, AS and MAS in osteogenic medium for 2 weeks: (A) ALP staining of BMSCs cultured on MAS; (B) The quantification result of alizarin red staining determined by absorbance at 405 nm; (a–c) are macroscopic view of ALP staining of BMSCs on BS, AS, and MAS, whereas (d–i) are microscopic view of ALP staining of BMSCs on (d, g) BS, (e, h) AS, and (f, i) MAS. Black scale bars = 500 μm, white scale bars = 200 μm. **P < 0.01, data are presented as mean ± SD, n = 4. BS, AS, and MAS were B. mori sericin, A. pernyi sericin, and mineralized A. pernyi sericin.

