
Figure 4.
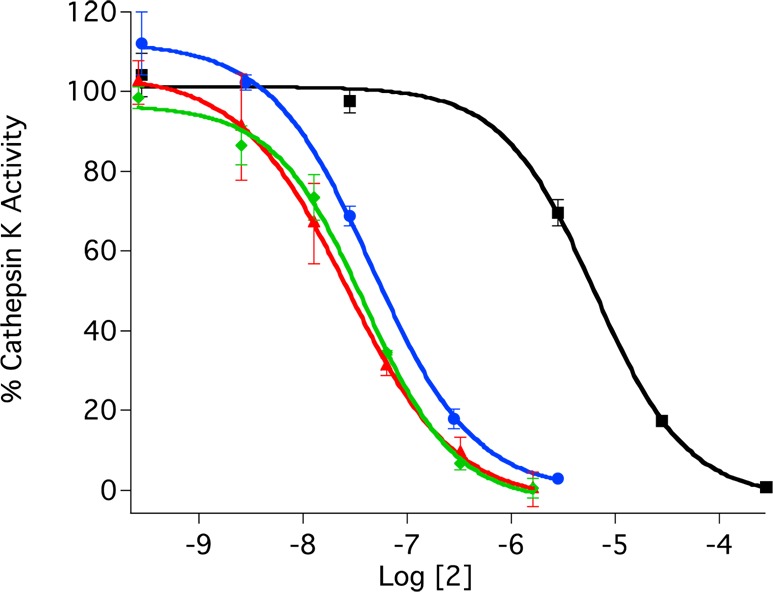
IC50 curves for ruthenium-caged inhibitor 2 (blue with irradiation and black without) and uncaged inhibitor 3 (red with irradiation and green without) against human cathepsin K. The enzyme activity was determined with the fluorogenic substrate Z-Gly-Pro-Arg-AMC and is expressed as a percentage, with 100% equal to the activity in the absence of inhibitor. Individual data points are the average of three wells, and the error bars are standard deviations. Data are representative of three independent experiments. Conditions: 0.4 M acetate buffer, pH 5.5, 1% DMSO, [cathepsin K] = 2 nM, [Z-Gly-Pro-Arg-AMC] = 100 μM, DTT = 8 mM, and 15 min of irradiation with a 365 nm light source (8 W).