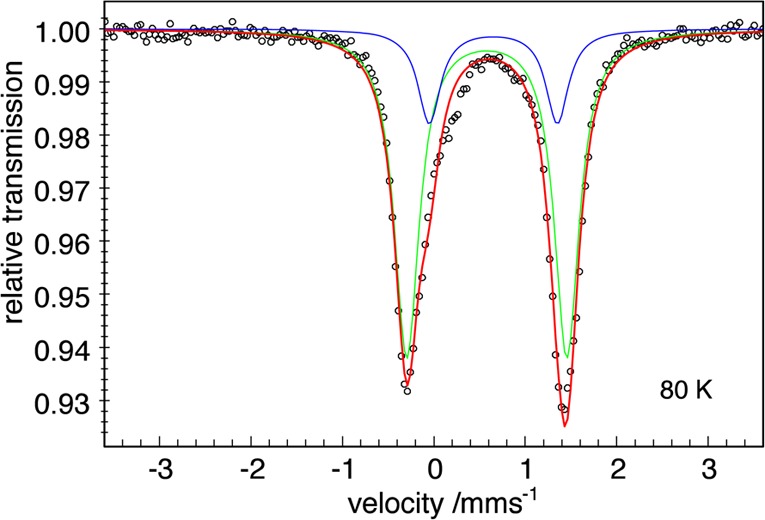
Figure 2.

Zero-field Mössbauer spectrum of [LtBuFe(μ-D)]2 (1-D2) recorded at 80 K. The signal with δ = 0.58 mm/s and |ΔEQ| = 1.74 mm/s accounted for 79% of the sample. The blue line represents the contribution of the oxo impurity, the green line represents the contribution of 1-D2, the red line represents the sum, and the black circles are the data.
