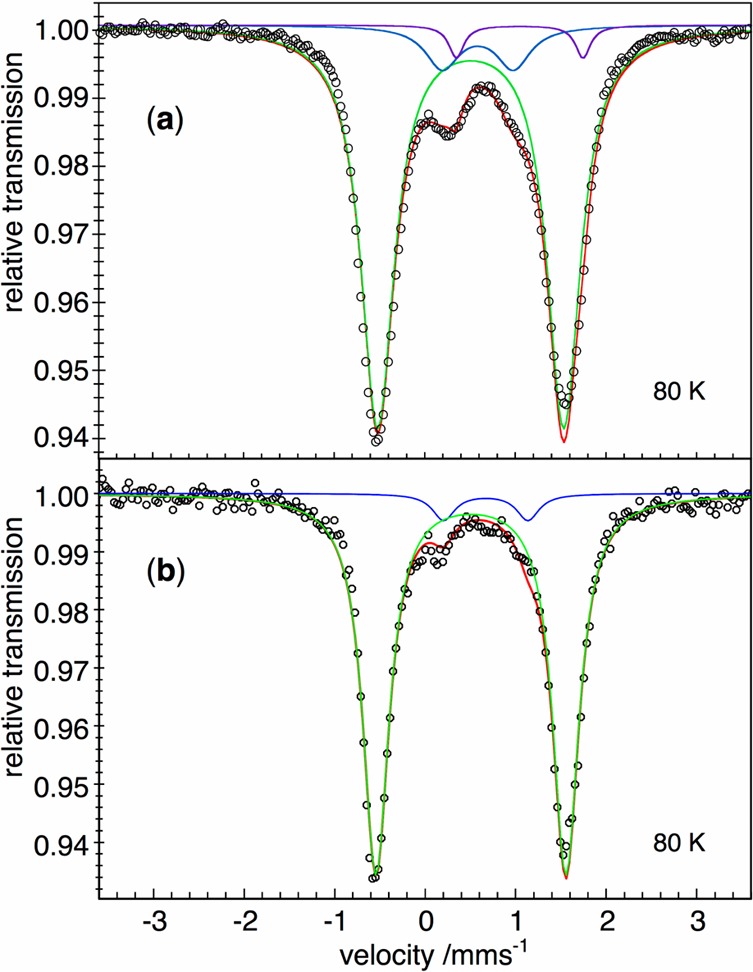
Figure 5.

(a) Mössbauer spectrum of [LMeFe(μ-H)]2 (3). (b) Mössbauer spectrum of [LMeFe(μ-D)]2 (3-D2). Both spectra were recorded at 80 K, with zero field. The black circles are the data, and the red lines represent the sums of a major doublet for 3 (green) and impurities (blue, purple) that are discussed in the Supporting Information.
