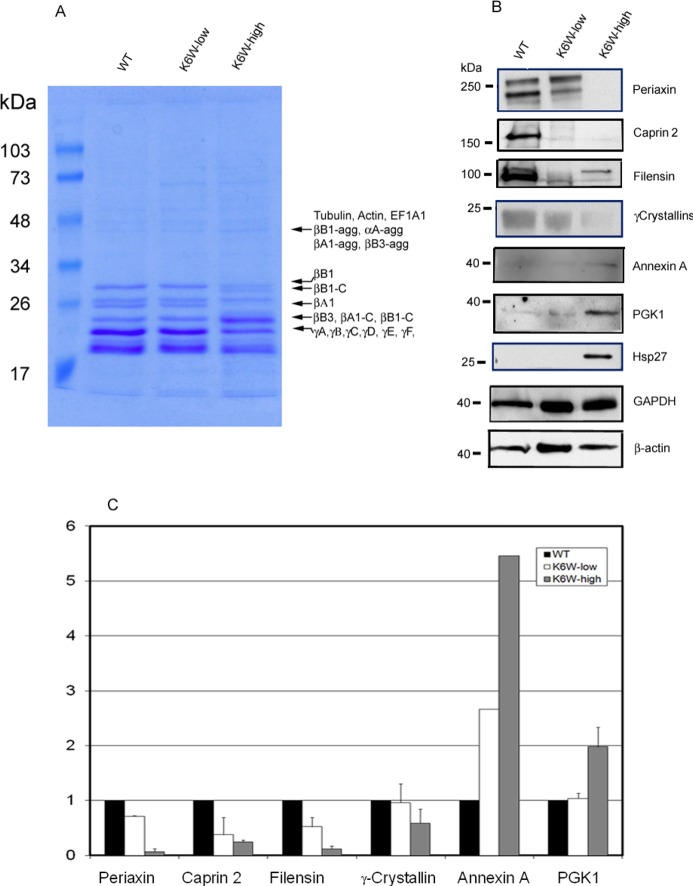
Figure 4.
Western blotting verification of differentially expressed proteins among lenses from WT, K6W-ubiqutin low expresser, and K6W-ubiquitin high expresser. P1 lenses from WT, low expressers, and high expressers of K6W-Ub transgenic mice were collected and homogenized. Proteins were separated by SDS-PAGE and stained by Coomassie blue to visualize proteins profiles (A). The bands that had visibly different staining were excised and identified by mass spectrometry after trypsin in-gel-digestion. The protein identifications of these proteins are indicated on the right of the gel. βB1-agg, αA-agg, βA1-agg, and βB3-agg represent aggregated forms of βB1, αA-,βB1-, and βB3-crystallins, respectively; βB1–C, and βA1-C represent cleaved forms of βB1- and βA1-crystallins. Levels of periaxin, caprin 2, filensin, γ-crystallins, annexin A, PGK1, and Hsp27 were determined by Western blotting (B). GAPDH and β-actin were used as protein loading controls. All experiments were repeated two times using pooled lens samples (three to five lenses in each group). Because of the weak signal, the level of annexin A in the second experiment was not quantified. Panel C is the densitometry quantitation of panel B using GAPDH as a reference. The candidate protein/GAPDH ratios for the WT lenses were designated as 1.0 to present relative levels of proteins in low and high expressers.

