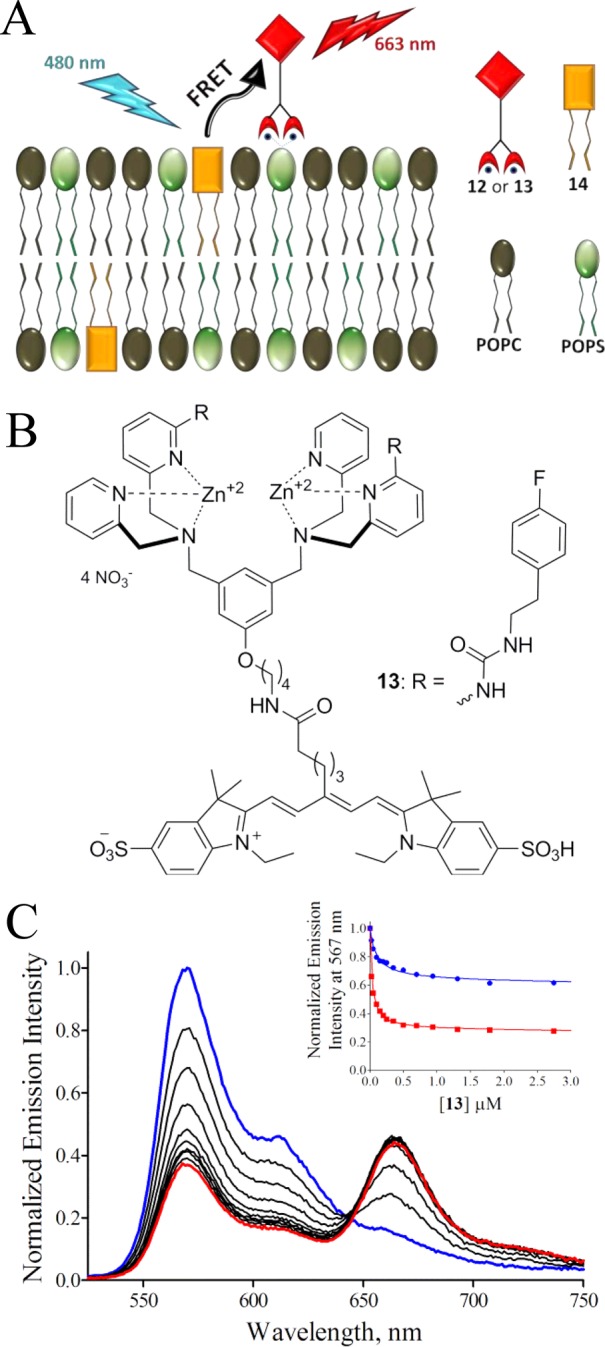
Figure 3.

Schematic cartoon of the FRET titration assay (A). Chemical structure of 13 (B). FRET profiles for titration of PS-rich vesicles (10 μM total lipid; POPS:POPC:14, 50:49:1) and 13 (C). FRET titration curves for either PS-rich (10 μL total lipid; POPS:POPC:14, 50:49:1; red squares) or PC vesicles (10 μL total lipid; POPC:14, 99:1; blue circles) and 13 (C-inset).
