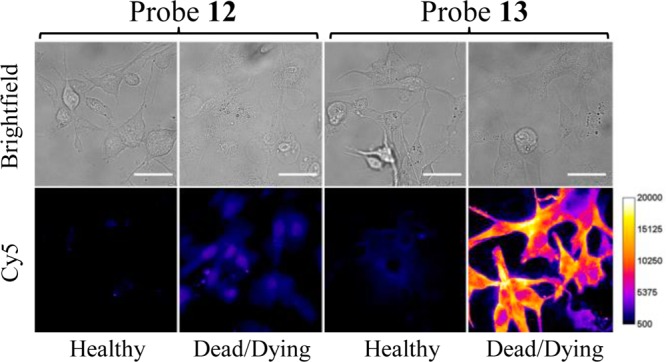
Figure 4.

Fluorescence micrographs (Bright field = top; Cy5 = bottom) of healthy or dead/dying MDA-MB-231 cells stained with 10 μM of either 12 (left two panels) or 13 (right two panels). The dead/dying cells were treated with etoposide (5 μM) for 16 h, then incubated with 10 μM of probe for 30 min at 37 °C and washed with HEPES buffer. Scale bar = 25 μm.
