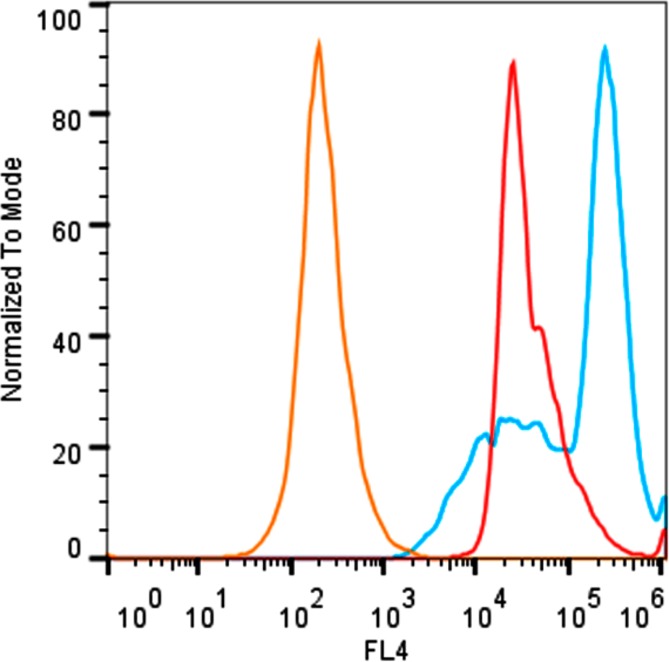
Figure 5.

Combined histogram plot depicting flow cytometry results for different populations of CHO-K1 cells; unstained healthy cells (orange), healthy cells stained with 10 μM of 13 (red), and cells treated with etoposide (15 μM, 13 h) then stained with 10 μM of 13 (blue).
