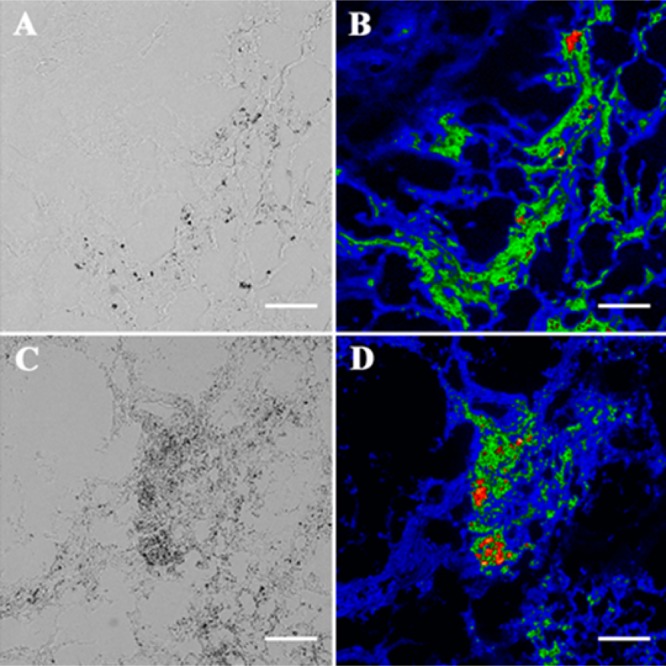
Figure 8.

Coregistered micrographs of histological slices (5 μm) of tumor core; the brightfield images (A, C) show necrotic cells as darker regions that colocalize with deep-red fluorescence emission of probe 12 (B) and probe 13 (D). Scale bar = 130 μm.
