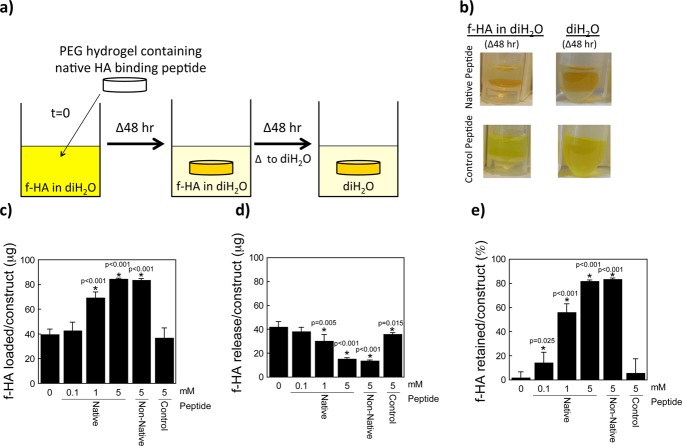
Figure 2.
Hyaluronan (HA) loading and retention capabilities of a HA binding peptide (RYPISRPRKRC), non-native HA binding peptide (RPSRPRIRYKC), and charge control peptide (GYPISGPGGGC). (a) Schematic of the experimental setup (f-HA loading for 48 h, f-HA release in diH2O for 48 h). (b) Representative images of hydrogels (containing the native HA binding peptide or charge control peptide) in solution corresponding to each 48 h step (i.e., the latter two images of the experimental setup). The fluorescein can be visualized by the yellow color showing retention of the f-HA in hydrogels with the native HA binding peptide in diH2O and with the charge control peptide showing continued release of f-HA in diH2O. (c) Total amount of f-HA loading into hydrogels after 48 h of immersion in a solution of 100 μg of f-HA in diH2O. (d) Release of loaded f-HA after 48 h of immersion in diH2O. (e) Percent-retained of loaded f-HA after immersion in diH2O. Data represent mean(SD) with a sample size of 5; *indicates samples were compared to no peptide control (0 mM).

