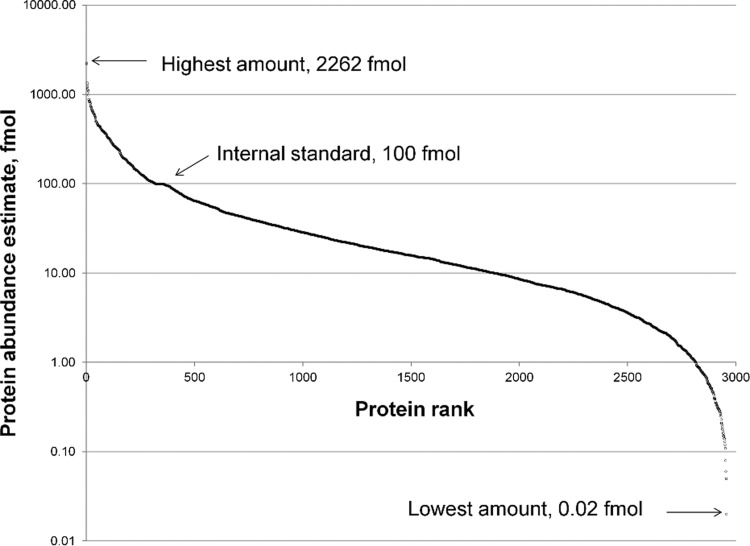
Figure 2.
Dynamic range of the method based on protein abundance estimates. The plot has the predicted S-shape, and the quantitative dynamic range covers five orders of magnitude based on 2956 data points derived from LC–IM–MSE data of all 37 samples. The value for the detection limit was identified as the lowest amount of a protein calculated by Scaffold software. The detection limit of this method was as low as 20 amol (Heat shock protein 8, sample E+C+#5), while the highest detected amount was 2.3 pmol (Myosin light chain, sample E–C+#8).

