
Figure 4.
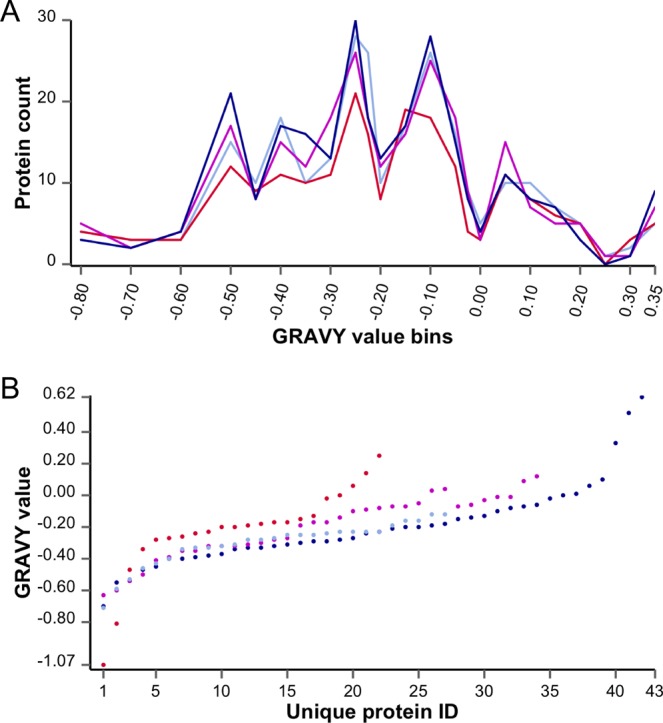
GRAVY values for proteins identified in E. coli lysates processed by eFASP using different digestion buffers. GRAVY values were calculated for (A) all proteins identified in each digest or (B) proteins unique to one digest condition. (A) GRAVY values for all proteins are binned and plotted for eFASP-0.1DCA (light blue), eFASP-0.2DCA (dark blue), eFASP-0.1DCA-0.1nOG (magenta), and eFASP-0.1nOG (red). (B) GRAVY values are plotted for proteins unique to eFASP-0.1DCA (light blue), eFASP-0.2DCA (dark blue), eFASP-0.1DCA-nOG (magenta), and eFASP-0.1nOG (red).