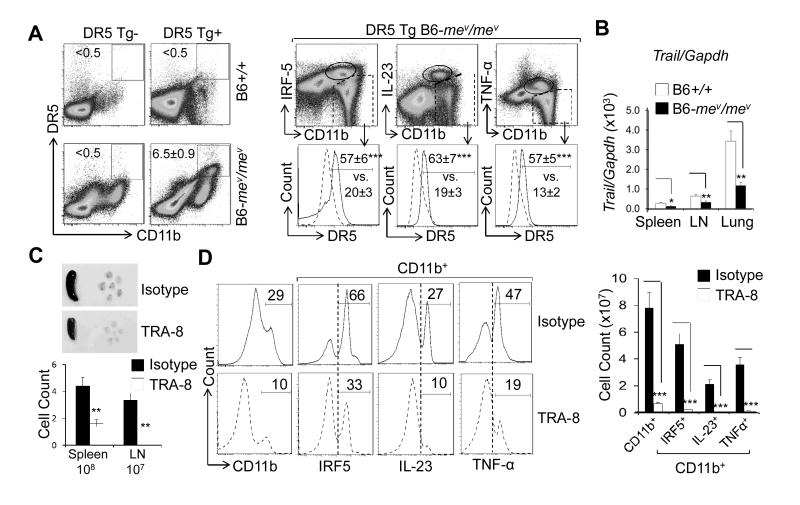
Figure 2.
Death receptor 5 (DR5) expression on inflammatory macrophages and TRA-8 –induced depletion of IRF-5+, IL-23+, and TNFα+ macrophages in DR5-transgenic (Tg) B6-mev/mev mice. A, Percentage of transgenic DR5+ cells in CD11b+ cells from the indicated mice (left panels), as determined by FACS analysis. CD11b+ cells from spleen of DR5-transgenic B6-mev/mev mice were further separated into subsets based on their expression levels of IRF-5, IL-23, and TNF-α (top right panels). Transgenic DR5 expression was then analyzed (bottom right panels). B, TRAIL expression in the spleen, lymph nodes (LNs), and lung of viable motheaten and wild-type mice, as determined by quantitative reverse transcription-polymerase chain reaction. C, Top panels, Images of representative spleen and LNs (cervical, axillary, and inguinal) from DR5-transgenic B6-mev/mev mice treated with TRA-8 or isotype control antibodies. Bottom panel, Cell counts in the spleen and LNs of the mice treated with TRA-8 or isotype control antibodies. D, Left panels, Percentage of CD11b+, CD11b+IRF-5+, CD11b+IL-23+, and CD11b+TNF-α+ macrophages after TRA-8 or isotype control treatments, as determined by FACS analysis. Right panel, Cell counts of the indicated populations. Values are the mean ± (SEM) (n = 5 mice per group). * = P < 0.05, ** = P < 0.01, *** = P < 0.001. See Figure1 for other definitions.

