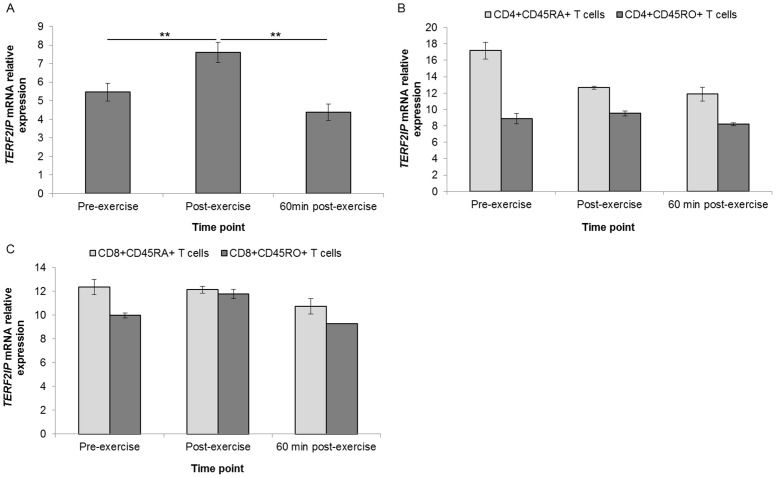
Figure 7. Differential regulation of TERF2IP mRNA interactions.
Relative expression in WBCs (n = 16) (A), in CD4+CD45RA+ and CD4+CD45RO+ T cell pools (n = 22) (B), and in CD8+CD45RA+ and CD8+CD45RO+ T cells pools (n = 22) (C). Gene expression data is expressed relative to endogenous reference gene (GAPDH). **indicates P<0.01.

