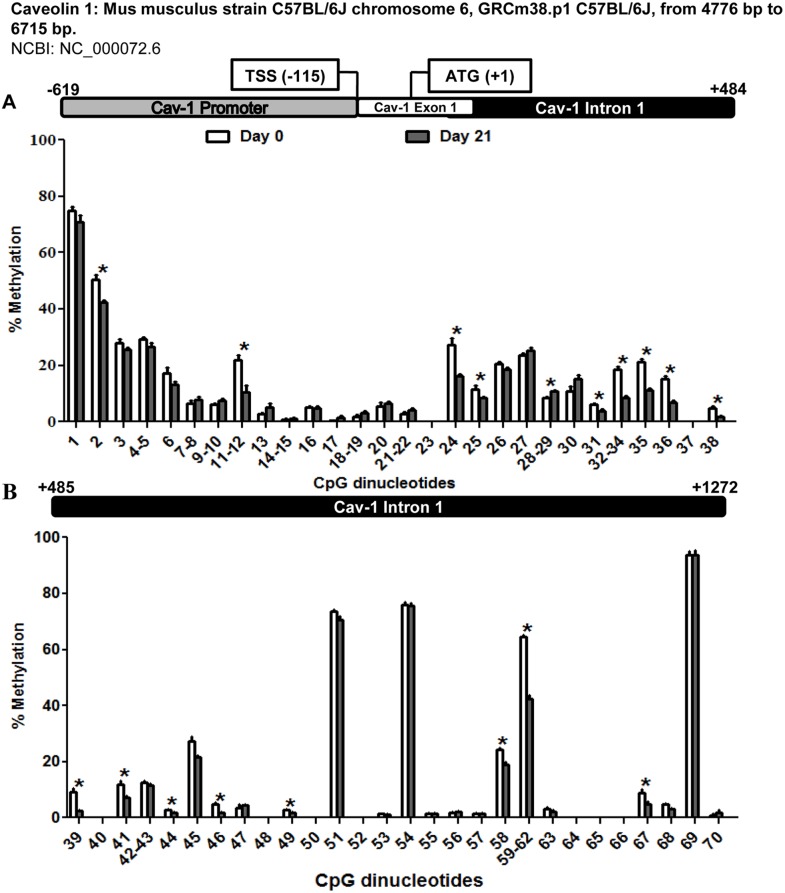
Figure 3. Methylation levels of the CpG dinucleotides in the caveolin 1 promoter exon 1 and intron 1 throughout 3T3-L1 cell adipogenesis.
The methylation level of 70-L1 adipocytic differentiation. MassARRAY system was used for the quantitative methylation analysis. (A) CpG 1 to 38 (B) Cpg 39 to 70 from the sequence under study. Data are means ± SEM of the methylation percentage of each CpG dinucleotide specified in the figure at days 0 and 21 of 3T3-L1 adipocyte differentiation. Groups were compared using the Mann-Whitney U test. Significant differences between day 0 and day 21 *. p≤0. 05. Gene structure is schematized over the graphs indicating the transcription start site (TSS) and the initiation codon (ATG) position.

