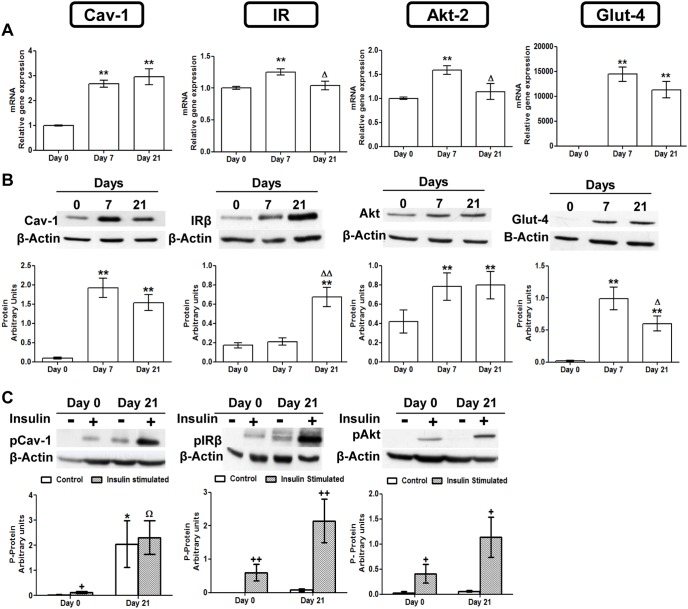
Figure 4. Caveolin 1 and insulin signaling intermediaries expression and activation throughout 3T3-L1 cell adipogenesis.
(A) mRNA levels. Data are means ± SEM of the ratio between each gene and cyclophilin expression at differentiation days 0, 7 and 21. Groups were compared using the ANOVA for a single factor and HSD-Tukey tests. (B) Protein levels. Data are means ± SEM of the ratio between each protein and β-Actin expression at differentiation days 0, 7 and 21. Groups were compared using the Wilcoxon signed rank test. (C) Cav-1 IR and AKT phosphorylation levels. Results represent data from cells before and after stimulation with insulin (50 nM, 10 minutes). Data are means ± SEM of the ratio between pCav-1, pIRβ and pAKT protein and β-Actin expression in the differentiation days 0 and 21. Groups were compared using the Wilcoxon signed rank test. Data are referred to day 0 *. p≤0.05, **. p≤0.01 or to day 7 Δ. p≤0.05, ΔΔ. p≤0.01. Data from insulin stimulated groups (C) were compared to their unstimulated control group +. p≤0.005 ++. p≤0.01 or to the insulin stimulated undifferentiated group Ω. p≤0.05.

