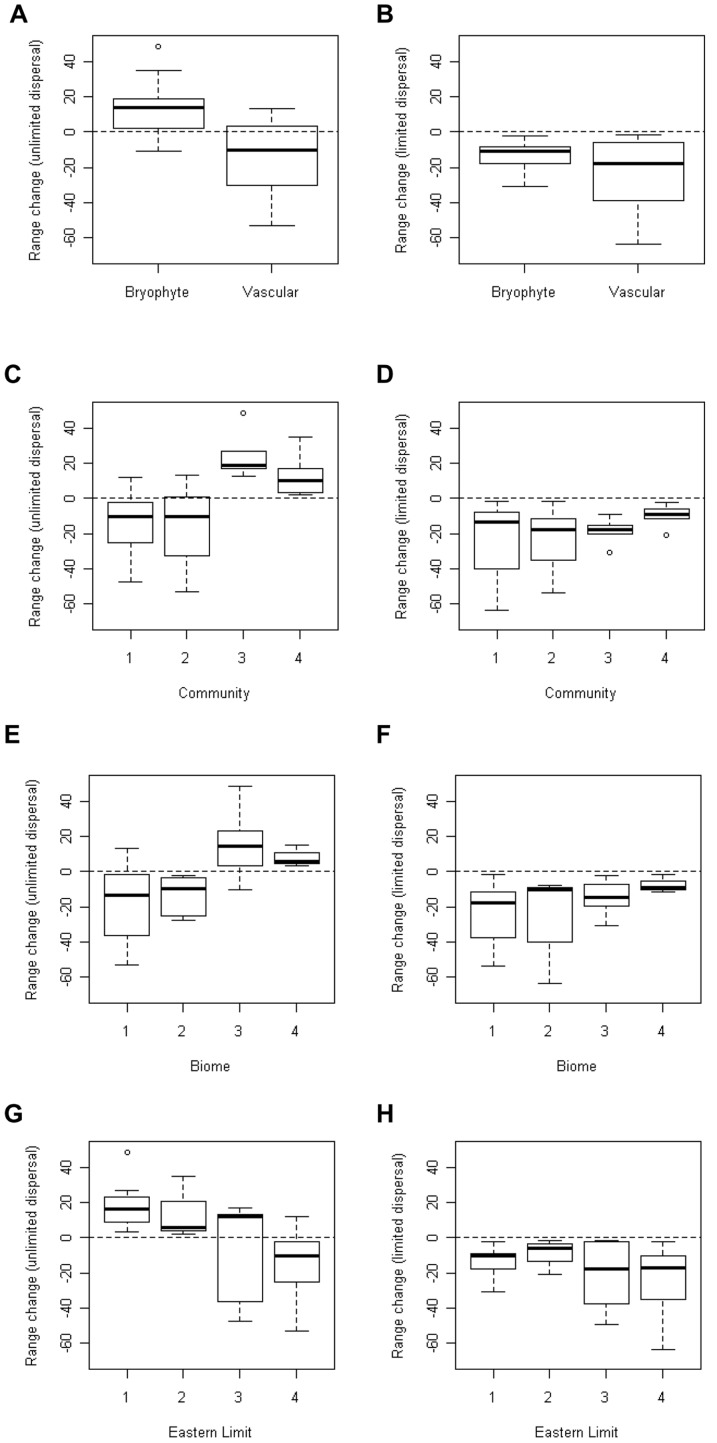
Figure 3. Boxplots of the change in range (%) of species under conditions of unlimited and limited dispersal, grouped by a number of categories.
(A)–(B) are grouped by plant type (bryophyte (n = 14) or vascular plant (n = 16)); (C)–(D) are grouped by community (1: montane heath (n = 10), 2: montane cliff (n = 9), 3: hepatic mat (n = 5), 4: oceanic montane bryophyte (n = 6)); (E)–(F) are grouped by biome [53], [54] (1: Arctic-montane (n = 10), 2: Boreo-arctic-montane (n = 5), 3: Boreal montane (n = 12), 4: Temperate and Southern Temperate (n = 3)); (G)–(H) are grouped by eastern limit category [53], [54] (1: hyperoceanic and oceanic (n = 8), 2: suboceanic (n = 3), 3: European, Eurosiberian and Eurasian (n = 5), 4: circumpolar (n = 14)). Range changes calculated using an ensemble of models produced by BIOMOD2.

