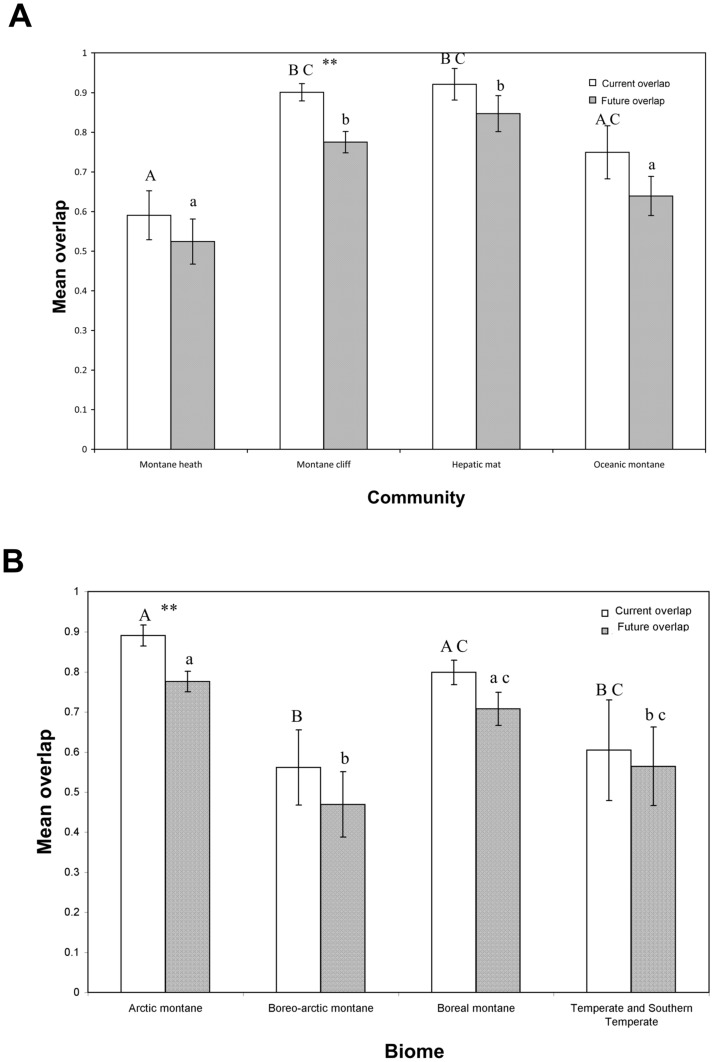
Figure 6. Proportion of overlap between current and future distribution of species groups and protected areas.
(A) Grouped by plant community; a different letter signifies a significant difference between categories (Wilcoxon ranked sum; p<0.05; capitals for present, lower case for future scenarios), categories that show a significant change in overlap between current and future (Wilcoxon signed rank; p<0.01) are denoted by **. (B) Grouped by biome; letters signify significant differences between categories (Wilcoxon ranked sum; p<0.05), categories that show a significant change in overlap between current and future (Wilcoxon signed rank; p<0.01) are denoted by **.

