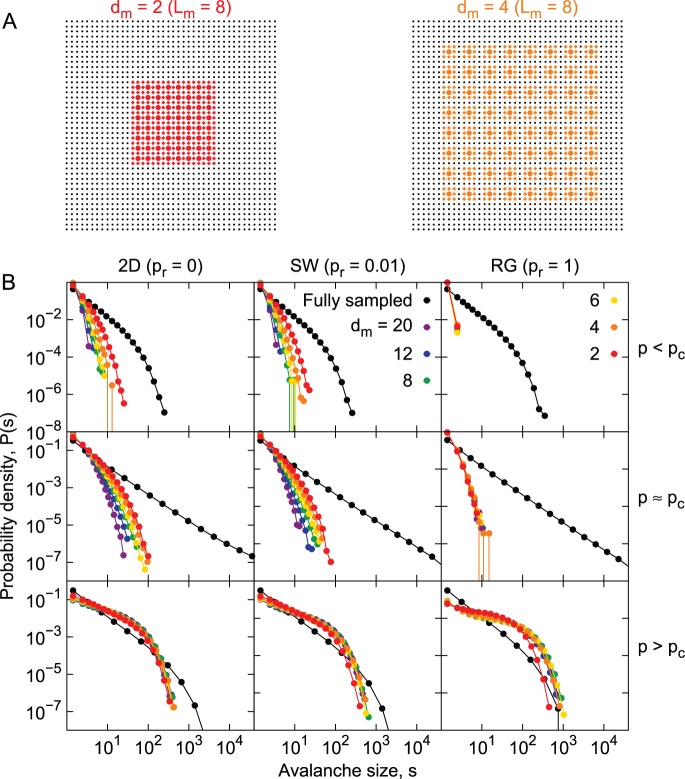
Figure 5. Undersampled size distributions: varying the density of sampled sites.
A) Examples of the sampling matrix. Only the colored sites are considered for avalanche measuring. Colored circles indicate virtual electrodes center, with diamond indicating possible sampling sites (see Methods). B) Avalanche size distributions obtained from different underlying topologies (columns) and dynamical regimes (rows), while sampling the systems with a MEA-like configuration. Colors represent different spacing between electrodes of the virtual sampling MEA (black for fully sampled systems).

