
Figure 6. Size distributions for anesthetized animals and undersampled models.
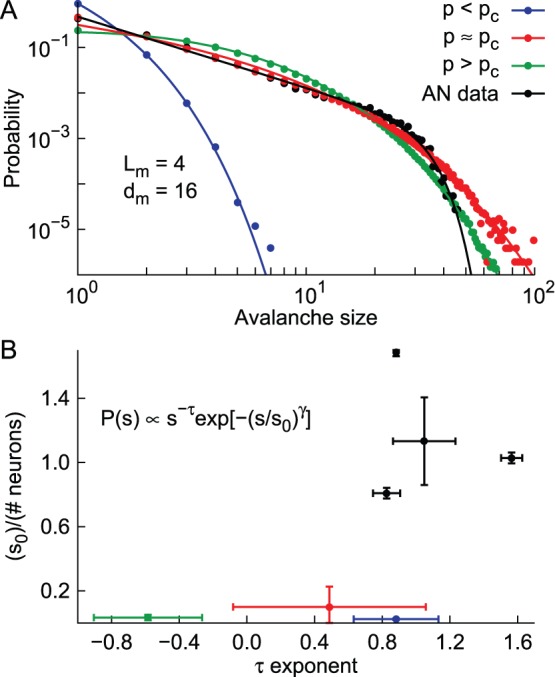
A) Avalanche size distributions for the model (subcritical blue, critical red and supercritical green) and an anesthetized rat (black). The MEA employed is the same for all cases ( ,
,  ). Temporal bins calculated from mean inter-event interval in all cases. Lines represent the best fit of a power law with a sharp cutoff. B) Parameters fitted for each of the model distributions showed in panel A, together with experimental distributions from 4 anesthetized rats. Error bars indicate standard deviation for the values.