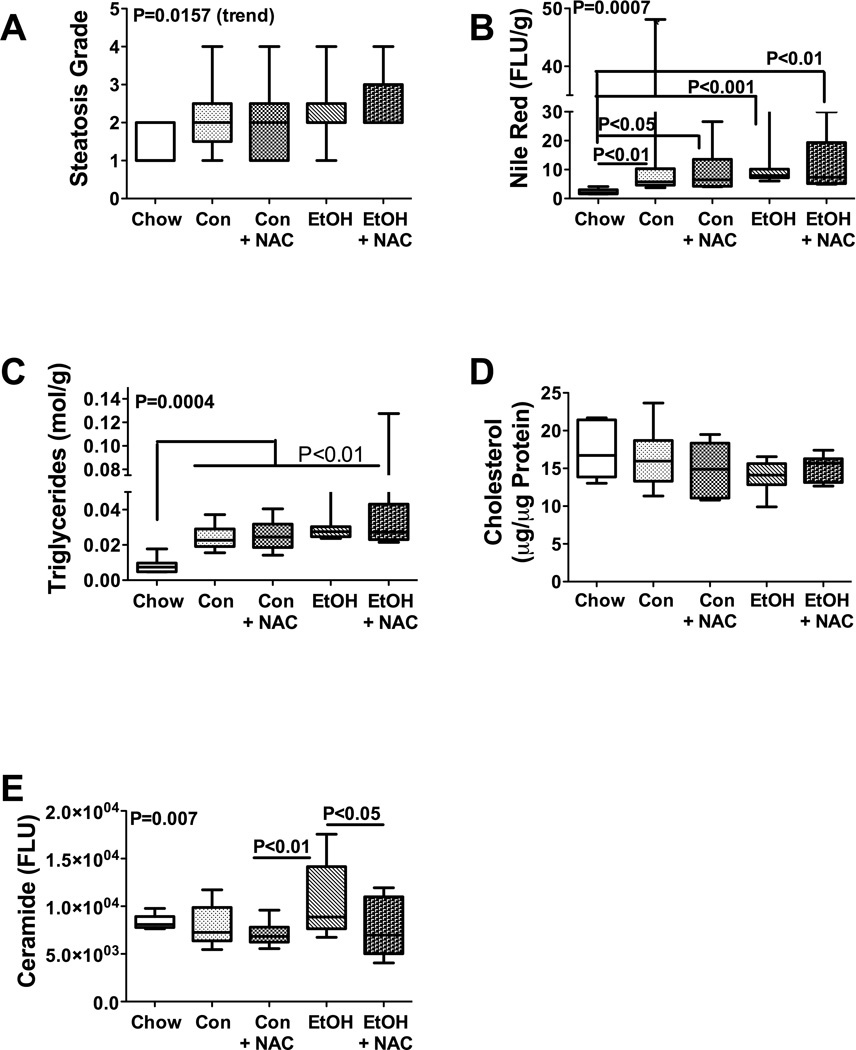
Figure 2.
Lipid and ceramide accumulations in liver following chronic ethanol and NAC treatment. (A) Severity of hepatic steatosis observed in H&E stained histological sections was graded blind on a scale from 1 to 4. (B–E) Lipid extracted from fresh frozen liver tissue was analyzed for (B) neutral lipid content using the Nile Red assay, (C) triglycerides, (D) cholesterol, or (E) ceramide immunoreactivity (see Material and Methods), and values were normalized to tissue sample weight or protein content. (F) CYP2E1 expression was measured by qRT-PCR analysis. Box plots depict medians (horizontal bars), 95% confidence interval limits, and range (whiskers). Inter-group comparisons were made using one-way ANOVA with the Tukey multiple comparison and linear trend post hoc tests. Significant P-values are indicated within the panels. Significant post-hoc linear trend analysis results are shown in the upper left quadrant of each panel.

