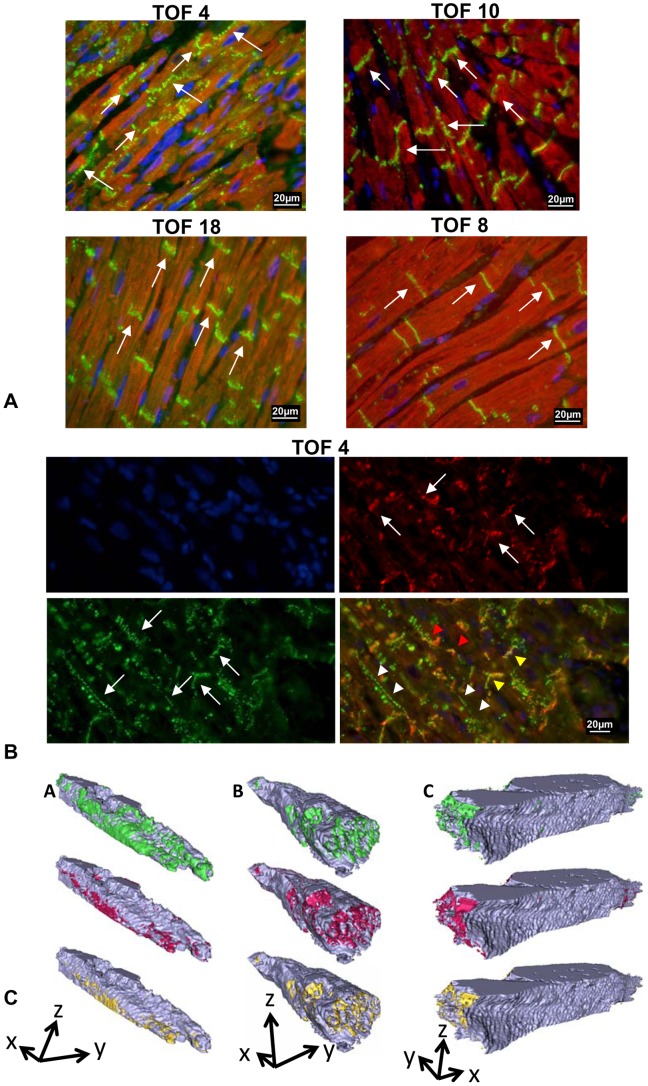
Figure 2. Original histological specimen of patients with TOF or DORV of Fallot type.
A: Representative specimen immuno-stained for Cx43 (GJA1) (green fluorescence) and troponin I (TNNI3) (red fluorescence), nuclei are counter-stained in blue. The specific Cx43 (GJA1) staining is indicated by white arrows. Note the strict Cx43 (GJA1) polarisation in specimens of patient 18 (TOF, age 8.67 years) and patient 8 (TOF, age 21.7 years) in contrast to the polar and lateral Cx43 (GJA1) distribution in patient 4 (TOF, age 0.57years) and 10 (TOF, age 0.41 years). B: Co-localisation of Cx43 (GJA1) (green fluorescence) and N- cadherin (CDH2) (red fluorescence), nuclei are counter- stained in blue. Original specimen of patient 4 (TOF, age 0.57 years) is shown. White arrows show the specific Cx43 (GJA1) or N-cadherin (CDH2) staining. Yellow arrow heads point to polar co-localised Cx43 (GJA1) and N-cadherin (CDH2) in the merged picture (downright of each of the four images), white arrow heads point towards lateral Cx43 (GJA1) staining (without N-cadherin (CDH2) and red arrow heads point to lateral Cx43 (GJA1) and N-cadherin (CDH2) staining (co-localisation). C: 3D reconstructions of representative cells from TOF patients (A) <2 years, (B) 2–12 years, and (C) >12 years. Cells show group- typical distribution patterns of Cx43 (GJA1) (green), N-cadherin (CDH2) (red) and their co-localisation (yellow). Arrows indicate cell orientation. Arrow length corresponds to 10 µm. It can be seen that co-localisation of lateral Cx43 (GJA1) with N- cadherin (CDH2) (co-localised protein = yellow) progressively declines from young (<2years, A) to elder (<12years, C) patients.

