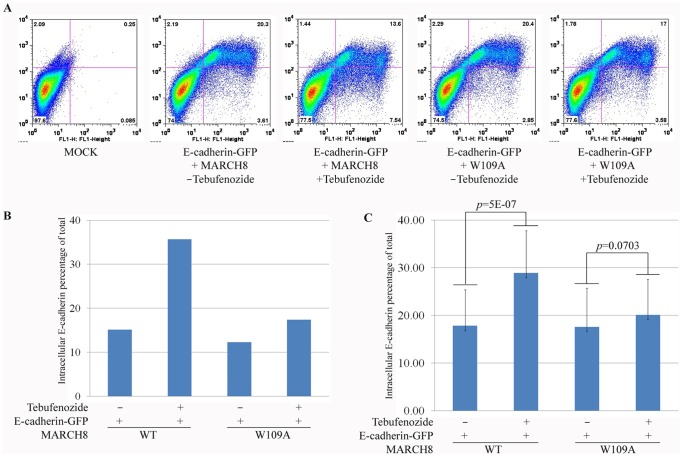
Figure 6. March8 overexpression reduces cell surface expression of E-cadherin in cultured cells.
(A) HEK293T cells were transfected with plasmids encoding E-cadherin-GFP, and inducible March8 WT or W109A mutant. After 12 h, cells were treated for 8 h with tebufenozide to induce March8 expression or maintained without the drug, as indicated (see Figure 7 for induction efficiency). For membrane E-cadherin staining, non-permeablized cells were stained using an antibody to an extracellular epitope (red). Cells were analyzed by flow cytometry in red (Y axis; surface E-cadherin) and green channels (X axis; total E-cadherin). Thus the upper right quadrant represents cells with E-cadherin at the surface, while the lower right quadrant represents non-surface (intracellular) E-cadherin. (B, C) Fraction of total E-cadherin that is intracellular. The data from the experiment in (A) are shown in (B). Panel (C) shows the average intracellular E-cadherin measured in 20 separate flow cytometry experiments. Induction of WT March8 led to an increase in intracellular E-cadherin that is highly significant, whereas induction of the W109A mutant did not lead to a significant change (student's T test).

