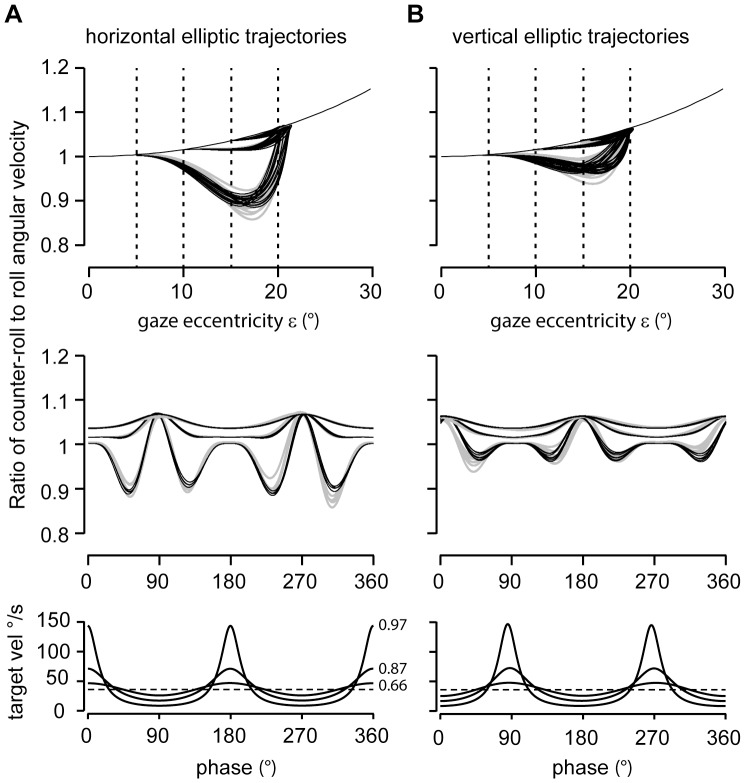
Figure 9. Ratio of counter-roll to roll angular velocity.
Comparison of reconstructed versus experimentally estimated counter-roll to roll ratios during horizontal (A) and vertical (B) elliptic target tracking. Upper panels: Counter-roll to roll ratios obtained from single trials for three different elliptic eccentricities plotted against the angular eccentricity ε of the gaze line by superimposing reconstructed (black lines) on experimentally estimated data (gray lines). Dashed vertical lines indicate the extreme vertices of elliptic trajectories (e = 0.66, 0.87 and 0.97; a = 20°, semi-major axis, b = 15°, 10°, and 5°, semi-minor axes). The single black curve displays the curve  , extending from 1 at ε = 0° to 1.15 at ε = 30°. Middle panels: Counter-roll to roll ratios as above plotted against tracking phase. Note increasing depth of modulation with increasing elliptic eccentricity, particularly during horizontal elliptic tracking. Abscissa: phase 0°, up gaze; phase +90°, rightward gaze position. Bottom panels: Torsional target velocity along the three elliptic trajectories with eccentricities 0.97, 0.87, and 0.66 plotted against phase angle. Dashed line indicates average torsional angular velocity across the three trajectories (36°/s).

