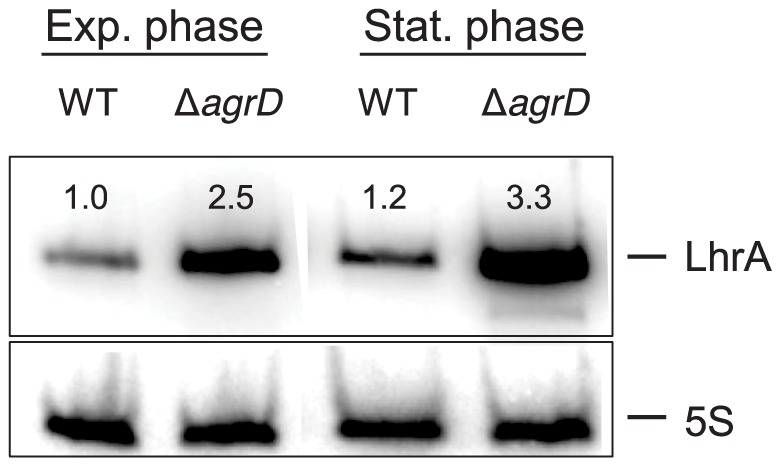
Figure 3. Northern blot analysis of lhrA transcripts in the wild-type EGD-e and the ΔagrD mutant.

The two strains were grown at 30 °C in LB+0,05% glucose to mid-exponential and stationary phase. The numbers above the bands correspond to the relative fold change in relation to lane 1, i.e. to the transcript levels of wild-type bacteria in mid-exponential phase. The results are normalized to the 5S loading control, shown below each band and are representative of a biological triplicate, collected and analyzed during the course of two independent experiments.
