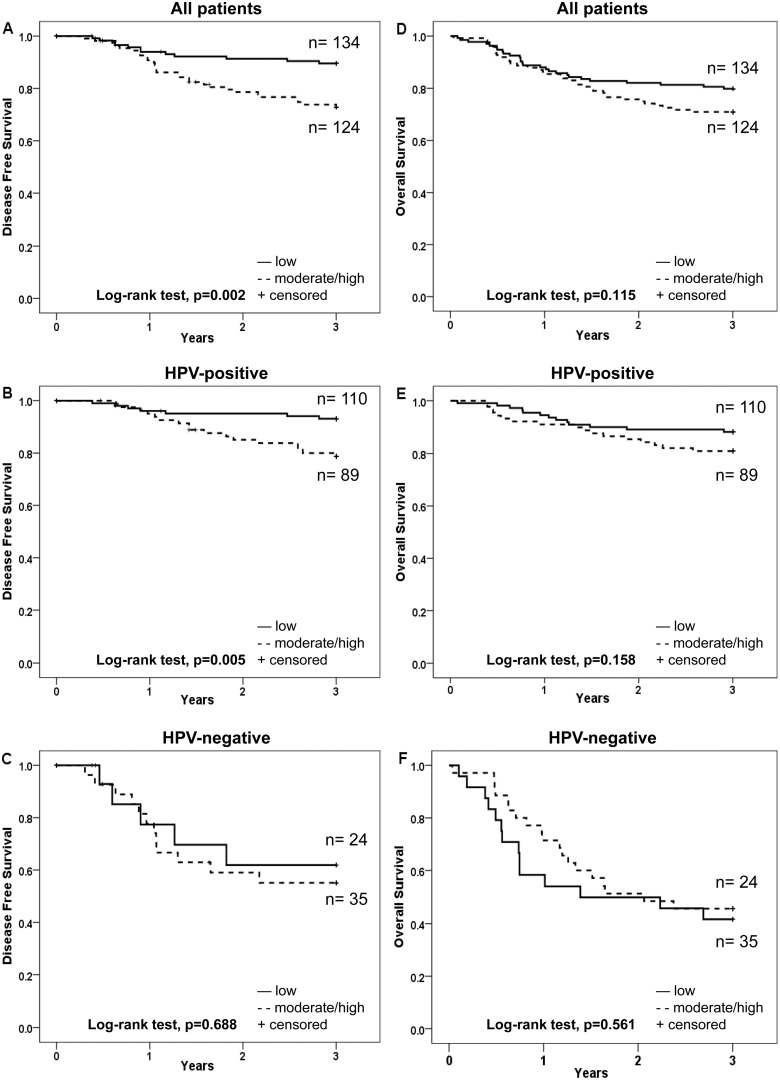
Figure 2. Kaplan-Meier curves for disease free survival (DFS) and overall survival (OS) of patients with TSCC or BOTSCC, treated with intention to cure and stratified according to fraction of cells positive for nuclear expression of LMP10.
A and D: DFS (A) and OS (D) for TSCC and BOTSCC irrespective of the HPV status of the tumour. B and E: DFS (B) and OS (E) of patients with HPV-positive TSCC and BOTSCC. C and F: DFS (C) and OS (F) of patients with HPV-negative TSCC and BOTSCC.

