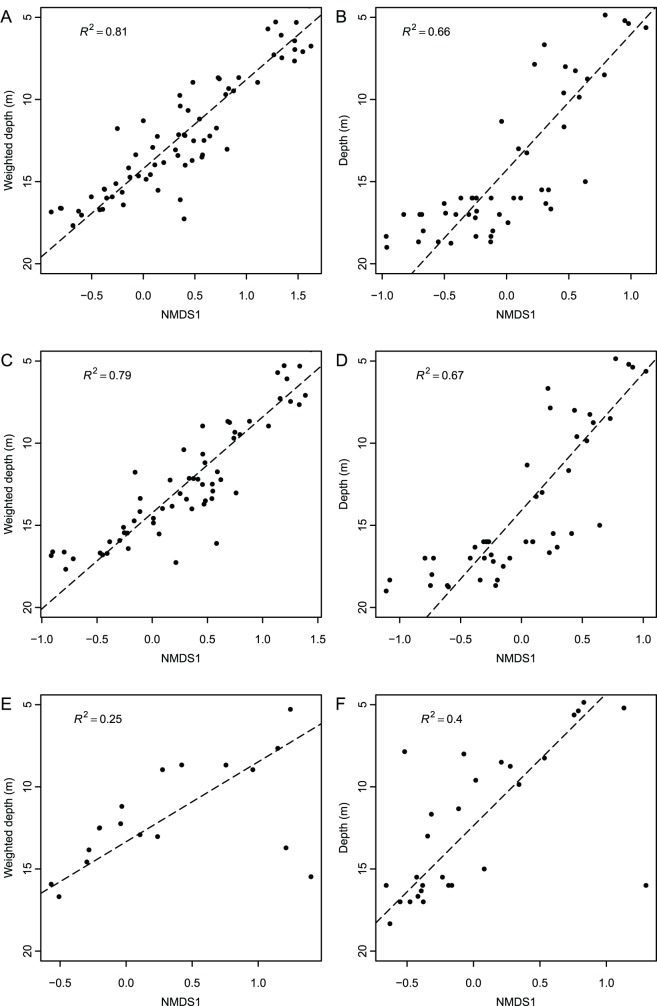
Figure 8. Effects of taphonomic biases and taxonomic scaling.
Reduced major axis regressions between Axis 1 scores and depth for: (A–B) all taxa, (C–D) preservable taxa (stress 0.2), and (E–F) heavily biomineralized mollusks (stress 0.2). Plots on the left utilize species scores, plots on the right use locality scores. Note the presence of two notable outliers in 8E (bottom right quadrant, bivalves Spisula solidissima and Ensis directus), and one in 8F (bottom right quadrant, locality 49), without which the relationship between species or sample depth and Axis 1 scores would greatly improve.

