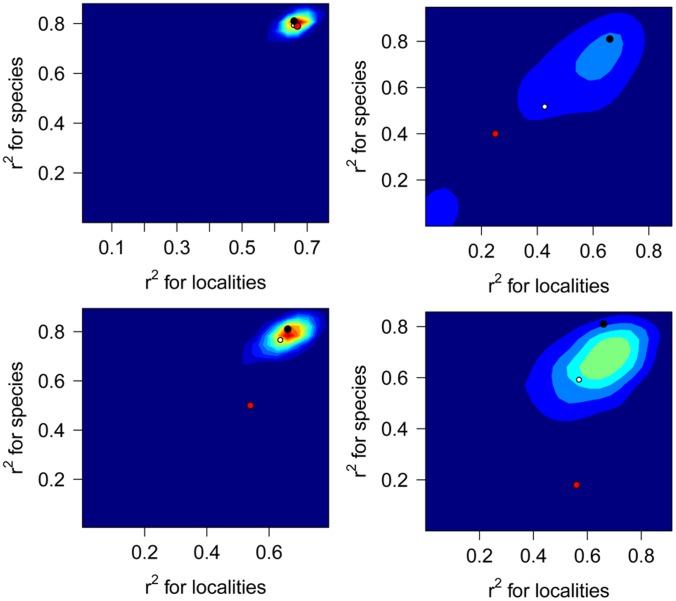
Figure 10. Distributions of r2 values resulting from random resampling.
(A) Preservable Taxa, (B) Heavily Biomineralized Mollusks, (C) Ocean localities, and (D) Small Grid. White dot denotes mean of simulations, red dot denotes actual observed value, and black dot denotes value for complete data set. Color contours within plots denote density from low (dark blue) to high (red).

