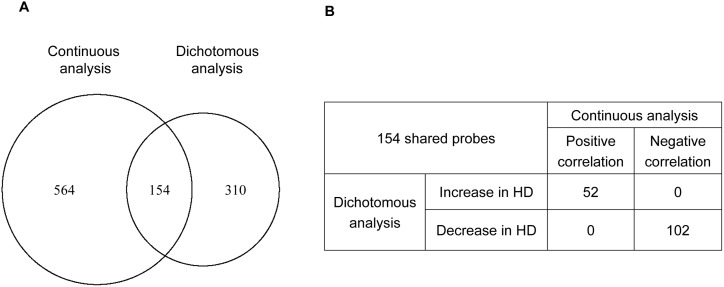
Figure 4. Significant probes in continuous and dichotomous analysis.
Pearson’s correlation test and Student’s-t test were used for continuous and dichotomous analysis, respectively. (A) From left to right, numbers in Venn diagram indicate the number of probes significant only in continuous analysis, probes significant in both continuous and dichotomous analysis, and probes significant only in dichotomous analysis by p-value cut-off of 0.01. We did not observe differences between shared genes and specific genes in terms of p-values, correlation coefficients, and fold-changes. (B) Probes significant in both analyses (154 probes) were further categorized based on the correlation coefficient and fold-change.

