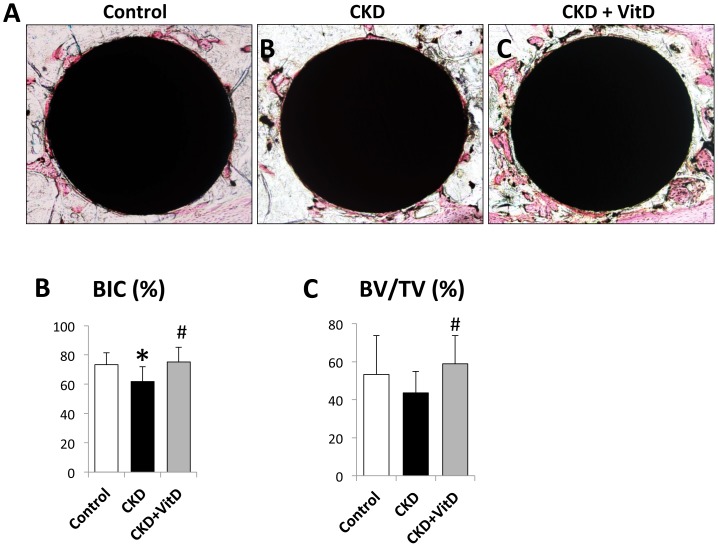
Figure 4. Histological and histomorphometrical analysis of the implants after 2-week healing.
(A) Representative images of undecalified sections from all three groups; VitD injection significantly increased (B) Bone-implant contact ratio (BIC, %), and (C) bone volume (BV/TV) in the circumferential zone within 100 µm of the implant surface. *: p<0.05 vs Control; #: p<0.05 vs CKD.

