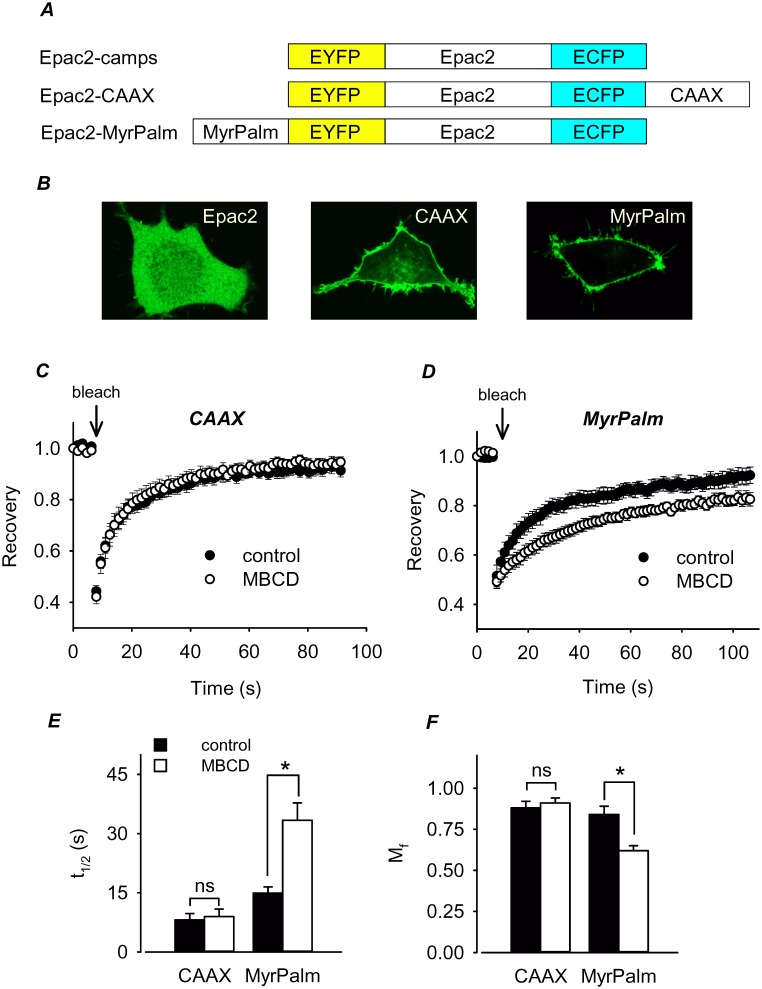
Figure 1. FRET-based biosensors targeted to different membrane microdomains.
A , structure of individual Epac2-based biosensor constructs. B , Confocal images of HEK293 cells expressing Epac2-camps (Epac2), Epac2-CAAX (CAAX), and Epac2-MyrPalm (MyrPalm). C and D, effect of cholesterol depletion on the time course of fluorescence recovery after photobleaching in HEK293 cells expressing Epac2-CAAX or Epac2-MyrPalm. E and F, summary of fluorescence recovery half-time (t1/2) and mobile fraction (Mf) in control and MBCD-treated cells. Differences between control (n = 14) and MBCD-treated (n = 10) cells expressing Epac2-CAAX were not significant (t1/2, p = 0.378; Mf, p = 0.517). Differences between control (n = 5) and MBCD-treated (n = 8) cells expressing Epac2-MyrPalm were significant (t1/2, p = 0.002; Mf, p = 0.003).

