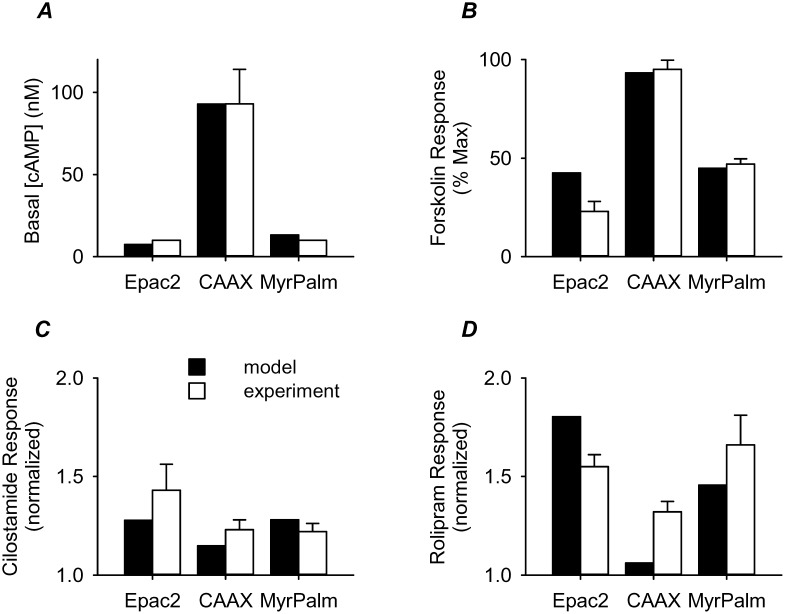
Figure 8. Comparison of computational and experimental results.
A, basal cAMP concentration. B, response to a 20 fold increase in adenylyl cyclase (AC) activity (model) and 1 µM forskolin (experiment) normalized to 300 fold increase in AC activity (model) and 10 µM forskolin (experiment). C, response to a 90% reduction of PDE3 activity (model) and 10 µM cilostamide in the presence of 3 nM isoproterenol (experiment) normalized to response to 3 fold increase in basal AC activity (model) and 3 nM isoproterenol (experiment). D, response to a 40% reduction of PDE4 activity (model) and 10 µM rolipram in the presence of 3 nM isoproterenol (experiment) normalized to a 5 fold increase in basal AC activity (model) and 3 nM isoproterenol (experiment).

