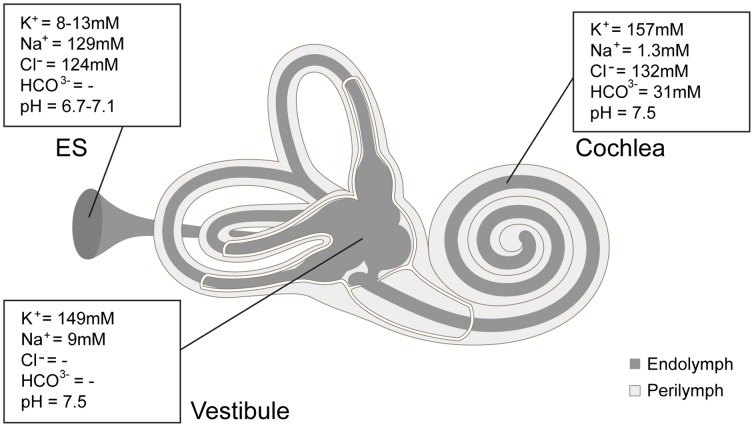
Figure 1. Schematic drawing of inner ear and fluid ion composition [33].
Dark gray area represents luminal space (endolymphatic space) filled with endolymph and light gray area represents abluminal space (perilymphatic space) filled with perilymph. ES; endolymphatic sac.

