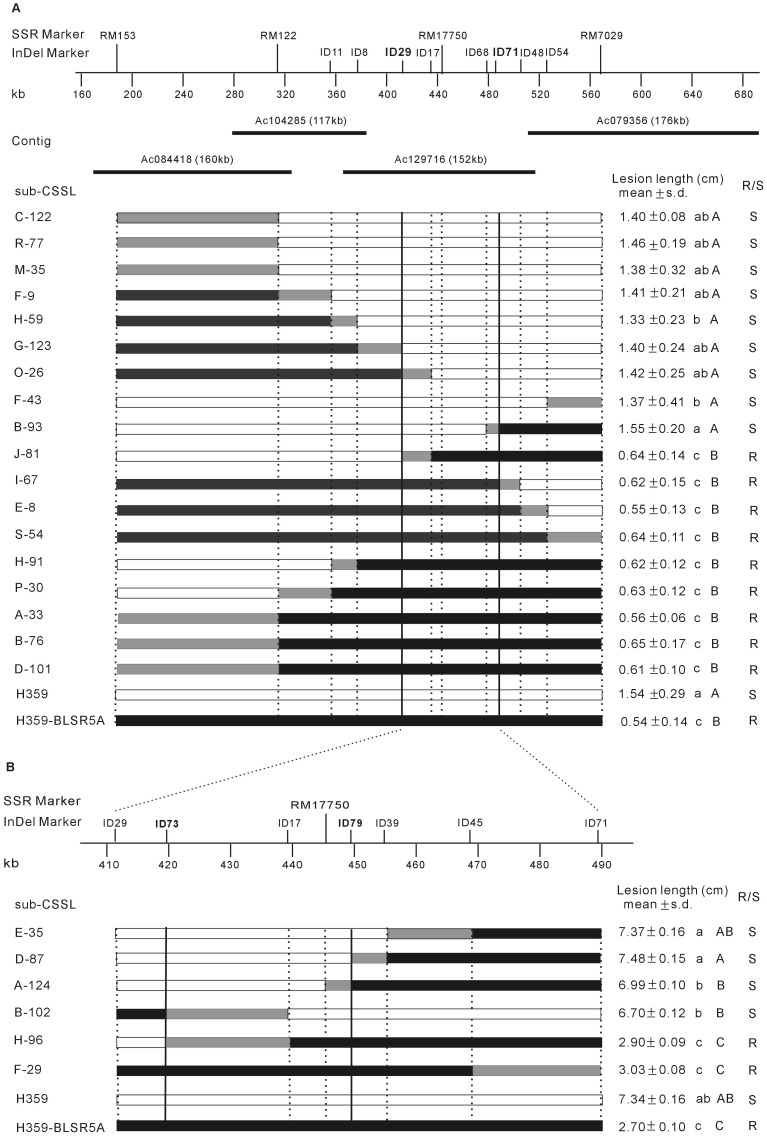
Figure 1. Physical map of the target region and graphical genotypes and resistance phenotypes of the sub-CSSLs.
The open bars, solid bars and gray bars represent H359, H359-BLSR5A and recombined segments, respectively. The vertical solid/dotted lines indicate molecular marker positions. The lowercase and uppercase letters after the lesion length indicate statistical difference at 0.05 and 0.01 significance levels, respectively. R/S: resistant/susceptible to BLS.

