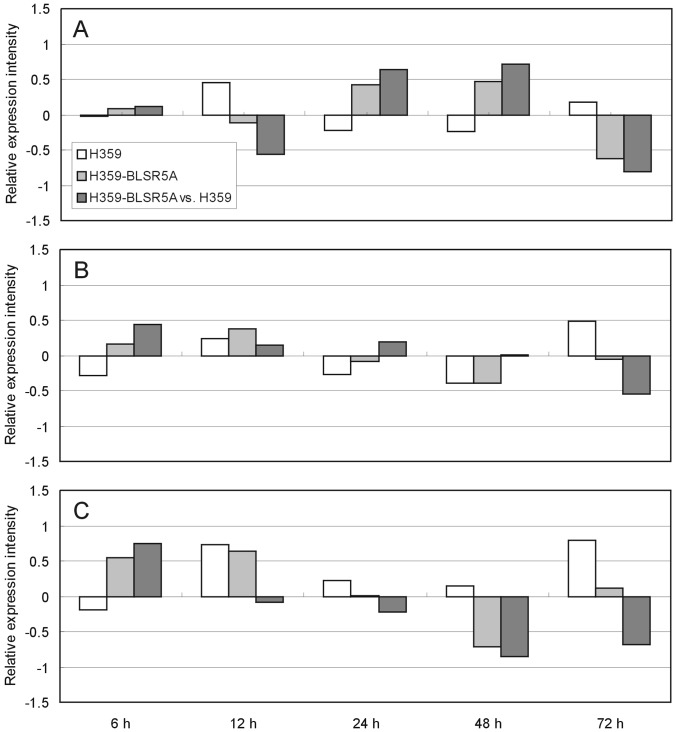
Figure 3. Expression response of LOC_Os05g01700 (A), LOC_Os05g01710 (B) and LOC_Os05g01730 (C) to BLS pathogen in the two parents.
The expression is thought to be significantly up−/down-regulated when the relative expression intensity, defined as log2[(expression intensity in treatment)/(expression intensity in control)], is greater/smaller than 1/−1.

