
Figure 3. Effect of paclitaxel on PCat-siRNA transfection.
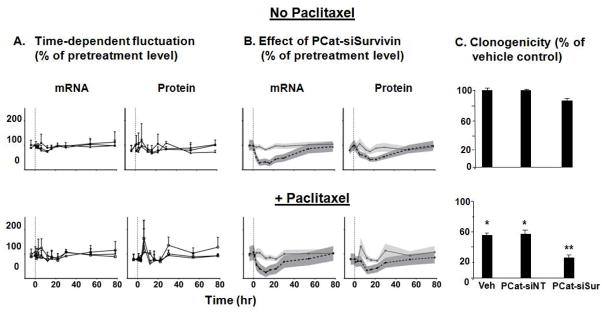
HS766T cells (over 80% confluence) were treated with paclitaxel (10 nM) for 4 hr, followed by PCat-siSurvivin treatment for 6 hr. (A) Fluctuation of mRNA and protein levels in the control groups over time: vehicle or single agent paclitaxel (diamonds), empty PCat vector (squares), PCat-siNT (triangles). 0 hr (indicated by vertical dashed line) refers to initiation of treatments. Baseline samples were taken at 4 hr before initiation of treatment. (B) Effect of PCat-siSurvivin on survivin mRNA and protein levels. The mean values of experimental data of the PCat-siSurvivin groups were compared to the combined results of the three control groups shown in Figure 3A. Symbols are mean values of experimental data (3 experiments). Shaded areas are the 95% confidence intervals of the experimental data. 0 hr (indicated by vertical dashed line) refers to initiation of treatments. (C) In vitro antitumor activity was determined using clonogenic assay. The PCat-siSurvivin concentration was 100 nM. *p<0.01 compared to vehicle control or PCat-siNT control, without paclitaxel treatment (top panel). **p<0.01 compared to single agent PCat-siSurvivin (top panel), and to single agent paclitaxel or paclitaxel+PCat-siNT combination (bottom panel).