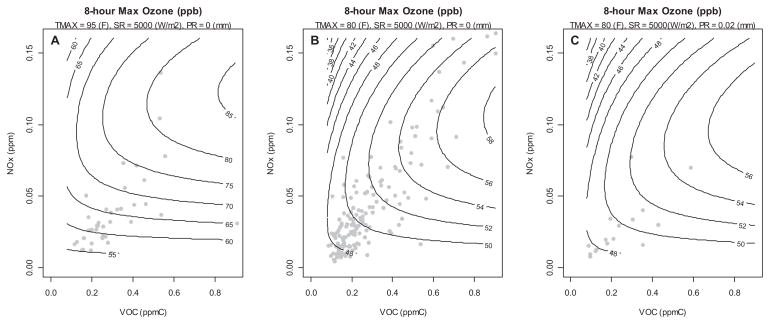
Figure 1.
Contour plots of estimated 8-hour maximum ozone as a function of NOx and VOC at fixed values of maximum daily temperature (TMAX), solar radiation (SR), and daily precipitation (PR). The overlayed scatter plot shows the observed NOx and VOC values that occurred on days for which TMAX, SR, and PR values were within 7 °F, 1000 W/m2, and 0.015 mm of the TMAX, SR, and PR values used to calculate the contour plots, respectively. These ranges were selected as half the IQR for each meteorology distribution. Therefore the points represent observed combinations of precursor levels and depict the range of ozone levels associated with these meteorology conditions.

