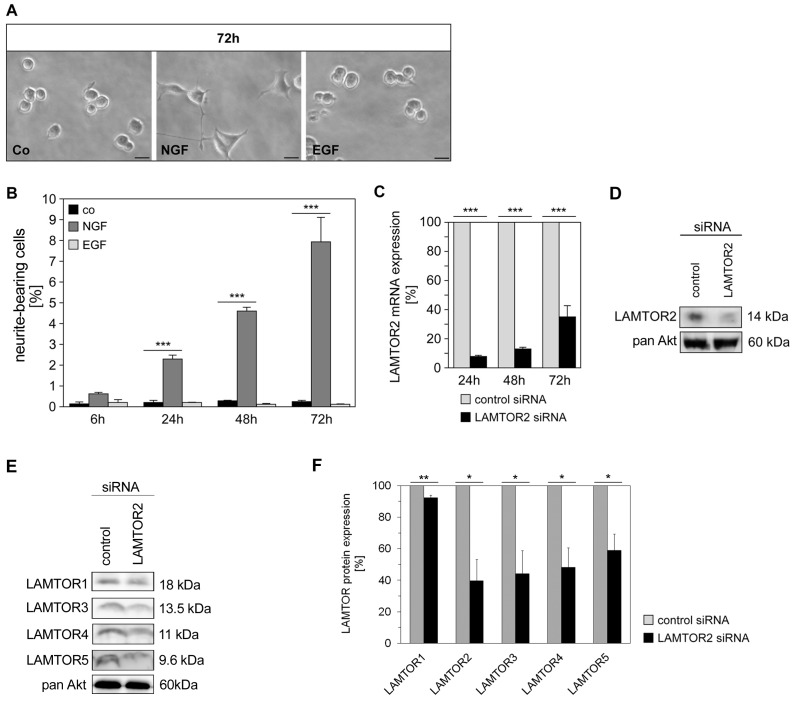
Figure 1. LAMTOR2 adapter protein modulates NGF-mediated differentiation.
(A, B) PC12 cells were stimulated with either NGF (25 ng/ml) or EGF (100 ng/ml). Neurite outgrowth was examined in 3–5 independent microscopic fields (72 h after stimulation shown in (A)). Percentages of neurite outgrowth (numbers reflecting neurite-bearing cells) after various time points (6 h–72 h) were calculated, counting 500–700 cells for each time point, and are depicted in (B). Microscopic images are representative of 3 independent experiments. Values represent the mean ± SEM, n = 3 (number of experiments). Scale bar = 20 µm. Differences were analyzed using one-way ANOVA followed by Dunnett’s multiple comparison test: ***p<0.001. (C) PC12 cells were transfected with control or specific LAMTOR2 siRNA, and mRNA expression levels were examined after 24 h, 48 h and 72 h by quantitative real-time RT-PCR; values represent the mean ± SEM, n = 3–5. Differences were analyzed using unpaired two-tailed t-test: ***p<0.001. (D) LAMTOR2 protein expression levels were shown by western blotting technique 48 h after transfection. Blot is representative of 3 independent experiments. (E) PC12 cells transfected with control or specific siRNA for LAMTOR2 were analyzed for protein expression of the other members of the LAMTOR complex, LAMTOR1 (p18), LAMTOR3 (MP1), LAMTOR4 (C7orf59) and LAMTOR5 (HBXIP) at 48 hours. Blots are representative of 3 experiments. (F) LAMTOR downregulation (%) was quantified and differences analyzed using unpaired two-tailed t-test: LAMTOR1 (p18; 7.63±1.50% reduction, **p<0.01), LAMTOR2 (p14; 60.25±13.54% reduction, *p<0.05), LAMTOR3 (MP1; 55.91±14.68% reduction, *p<0.05), LAMTOR4 (C7orf59; 51.85±12.52% reduction, *p<0.05) and LAMTOR5 (HBXIP; 41.06±10.33% reduction, *p<0.05).

