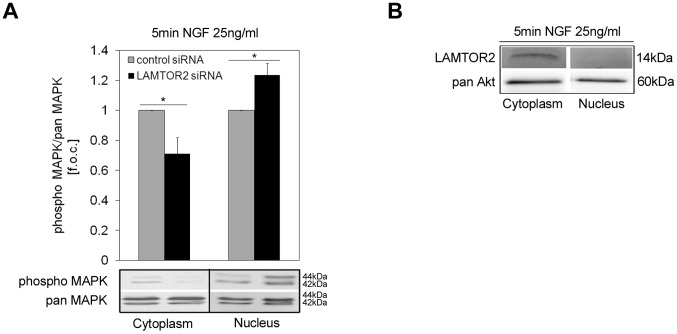
Figure 6. Active MAPK and LAMTOR2 distributions in cellular fractions.
PC12 cells were transfected with control or specific siRNA for LAMTOR2. After 24(25 ng/ml) for 5 min and lysed for cytoplasmic and nuclear fractions. Fractions were separated and immunoblotted. (A) MAPK activation was quantified after scanning the immunoreactive bands with the Fusion FX7 image acquisition system (Vilber Lourmat). Values represent the means ± SEM, n = 5. Differences were analyzed using unpaired two-tailed t-test: *p<0.05. (B) LAMTOR2 and pan Akt protein expression was analyzed in cytoplasmic and nuclear fractions. Blots are representative of 4 independent experiments.

