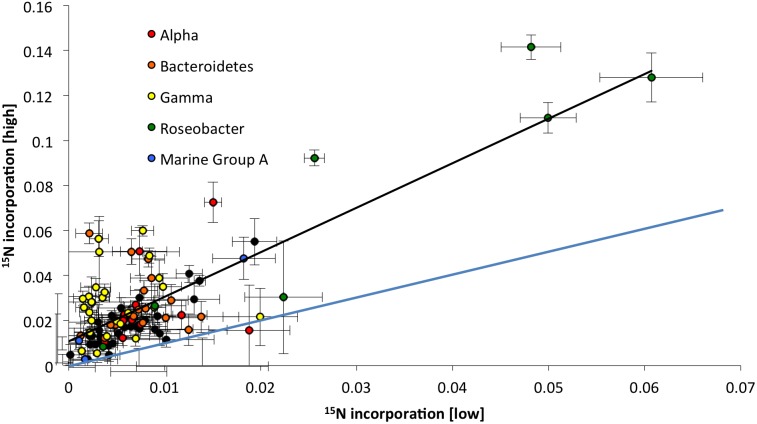
Figure 1. Pairwise comparisons of isotopic incorporation of 15N labeled AAs by 107 16S rRNA phylotypes from SF Bay at two concentrations (high, 5 micromolar and low, 50 nanomolar).
Each data point represents the HCE (hybridization corrected enrichment) for a probe set (the slope of delta permil divided by fluorescence). Error bars indicate two standard errors of the slope calculation. The black line represents the linear regression and the blue the 1 to l line.

