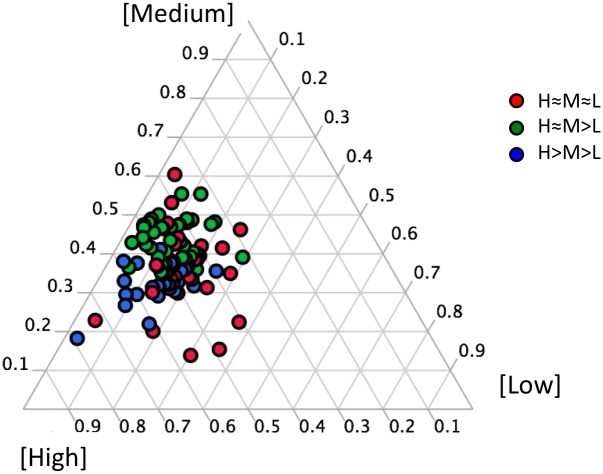
Figure 4. Ternary plot graphically depicting the ratios of the rRNA phylotype-specific incorporation to varying AA concentrations added to SF Bay water.
Data are color-coded according to the trophic strategies identified in Fig. 3. The position of each data point in relation to the three corners represents the relative contribution of each concentration response.

