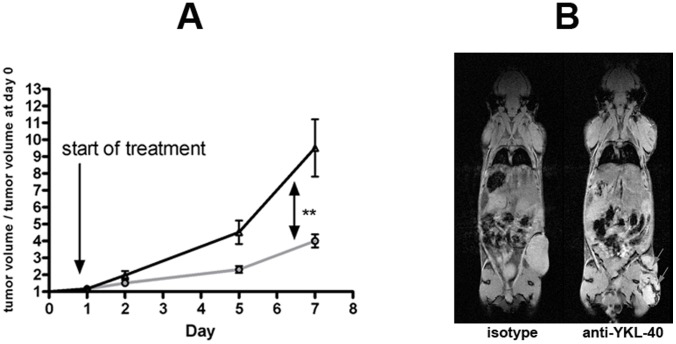
Figure 3. Tumor growth as observed by MRI after injection of 106 LOX melanoma cells during treatment with anti-YKL-40 monoclonal antibody or isotype control.
For each animal, tumor volume calculated on basis of MRI data at each time point was divided by the tumor volume at day 0. Black curve: treatment with anti-YKL-40 antibody; grey curve: treatment with isotype control; **: P = 0.0011, two way ANOVA (A). T2* weighted MRI of two Balb/c scid mice with LOX tumors treated with isotype or anti-YKL-40 monoclonal antibody seven days after start of treatment. Observed hemorrhage is indicated by arrows (B).

